

Spatial Disparity in Access to Improved Source …
175
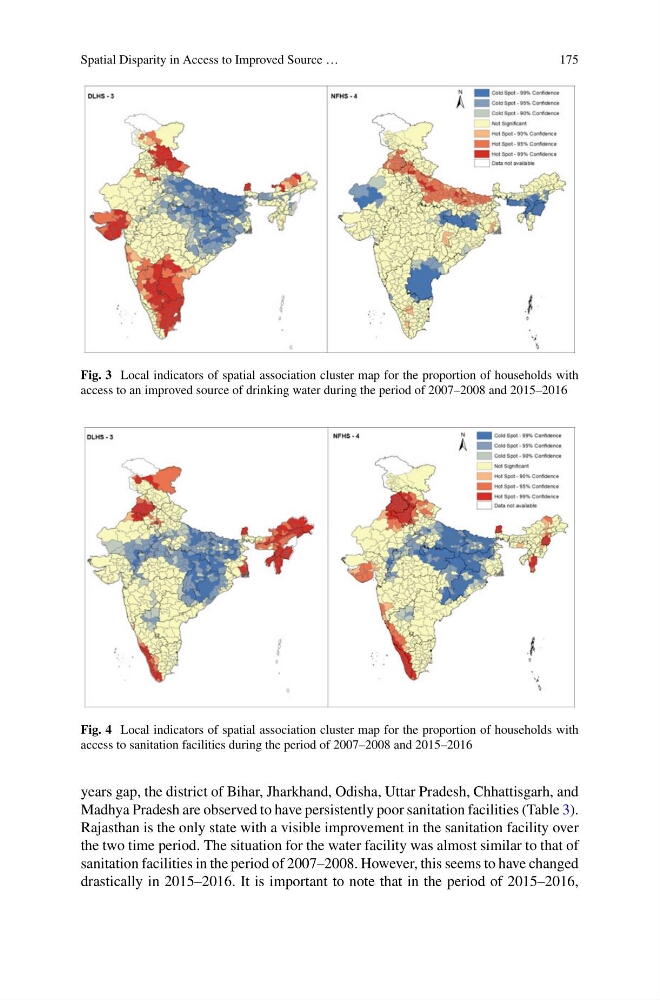
Fig. 3 Local indicators of spatial association cluster map for the proportion of households with
access to an improved source of drinking water during the period of 2007–2008 and 2015–2016
Fig. 4 Local indicators of spatial association cluster map for the proportion of households with
access to sanitation facilities during the period of 2007–2008 and 2015–2016
years gap, the district of Bihar, Jharkhand, Odisha, Uttar Pradesh, Chhattisgarh, and
Madhya Pradesh are observed to have persistently poor sanitation facilities (Table 3).
Rajasthan is the only state with a visible improvement in the sanitation facility over
the two time period. The situation for the water facility was almost similar to that of
sanitation facilities in the period of 2007–2008. However, this seems to have changed
drastically in 2015–2016. It is important to note that in the period of 2015–2016,
175
Fig. 3 Local indicators of spatial association cluster map for the proportion of households with
access to an improved source of drinking water during the period of 2007–2008 and 2015–2016
Fig. 4 Local indicators of spatial association cluster map for the proportion of households with
access to sanitation facilities during the period of 2007–2008 and 2015–2016
years gap, the district of Bihar, Jharkhand, Odisha, Uttar Pradesh, Chhattisgarh, and
Madhya Pradesh are observed to have persistently poor sanitation facilities (Table 3).
Rajasthan is the only state with a visible improvement in the sanitation facility over
the two time period. The situation for the water facility was almost similar to that of
sanitation facilities in the period of 2007–2008. However, this seems to have changed
drastically in 2015–2016. It is important to note that in the period of 2015–2016,