

Spatial Disparity in Access to Improved Source …
173
surrounded by districts with high proportion. Cold spots (low-low) are formed by
districts with low proportion surrounded by districts with low proportion of access
to drinking water. Patterns such as high-low and low-high indicate clustering of
districts with high proportion surrounded by districts with low proportion and vice
versa. Similar interpretation is applicable for spatial clustering of the proportion of
access to sanitation facility. The districts contributing to the formation of cold spots
were of interest in this study.
4 Results
The proportion of households with access to an improved source of drinking water
and access to sanitation facility varied during the period of 2007–2008 and 2015–
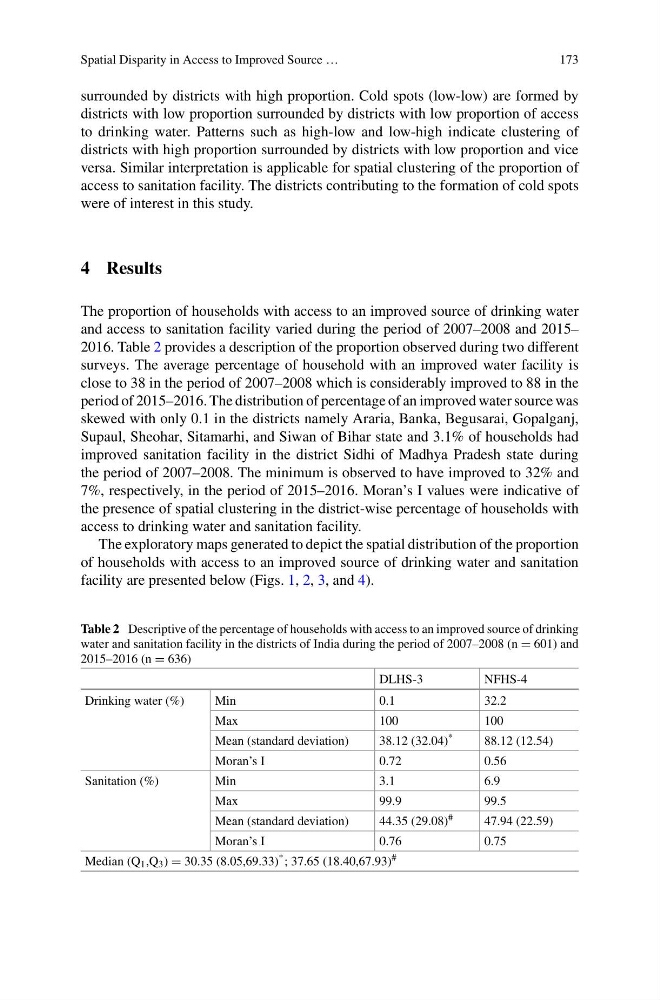
2016. Table 2 provides a description of the proportion observed during two different
surveys. The average percentage of household with an improved water facility is
close to 38 in the period of 2007–2008 which is considerably improved to 88 in the
period of 2015–2016. The distribution of percentage of an improved water source was
skewed with only 0.1 in the districts namely Araria, Banka, Begusarai, Gopalganj,
Supaul, Sheohar, Sitamarhi, and Siwan of Bihar state and 3.1% of households had
improved sanitation facility in the district Sidhi of Madhya Pradesh state during
the period of 2007–2008. The minimum is observed to have improved to 32% and
7%, respectively, in the period of 2015–2016. Moran’s I values were indicative of
the presence of spatial clustering in the district-wise percentage of households with
access to drinking water and sanitation facility.
The exploratory maps generated to depict the spatial distribution of the proportion
of households with access to an improved source of drinking water and sanitation
facility are presented below (Figs. 1, 2, 3, and 4).
Table 2 Descriptive of the percentage of households with access to an improved source of drinking
water and sanitation facility in the districts of India during the period of 2007–2008 (n = 601) and
2015–2016 (n = 636)
DLHS-3
NFHS-4
Drinking water (%)
Min
0.1
32.2
Max
100
100
Mean (standard deviation)
38.12 (32.04) *
88.12 (12.54)
Moran’s I
0.72
0.56
Sanitation (%)
Min
3.1
6.9
Max
99.9
99.5
Mean (standard deviation)
44.35 (29.08) #
47.94 (22.59)
Moran’s I
0.76
0.75
Median (Q 1 ,Q 3 ) = 30.35 (8.05,69.33) * ; 37.65 (18.40,67.93) #
173
surrounded by districts with high proportion. Cold spots (low-low) are formed by
districts with low proportion surrounded by districts with low proportion of access
to drinking water. Patterns such as high-low and low-high indicate clustering of
districts with high proportion surrounded by districts with low proportion and vice
versa. Similar interpretation is applicable for spatial clustering of the proportion of
access to sanitation facility. The districts contributing to the formation of cold spots
were of interest in this study.
4 Results
The proportion of households with access to an improved source of drinking water
and access to sanitation facility varied during the period of 2007–2008 and 2015–
2016. Table 2 provides a description of the proportion observed during two different
surveys. The average percentage of household with an improved water facility is
close to 38 in the period of 2007–2008 which is considerably improved to 88 in the
period of 2015–2016. The distribution of percentage of an improved water source was
skewed with only 0.1 in the districts namely Araria, Banka, Begusarai, Gopalganj,
Supaul, Sheohar, Sitamarhi, and Siwan of Bihar state and 3.1% of households had
improved sanitation facility in the district Sidhi of Madhya Pradesh state during
the period of 2007–2008. The minimum is observed to have improved to 32% and
7%, respectively, in the period of 2015–2016. Moran’s I values were indicative of
the presence of spatial clustering in the district-wise percentage of households with
access to drinking water and sanitation facility.
The exploratory maps generated to depict the spatial distribution of the proportion
of households with access to an improved source of drinking water and sanitation
facility are presented below (Figs. 1, 2, 3, and 4).
Table 2 Descriptive of the percentage of households with access to an improved source of drinking
water and sanitation facility in the districts of India during the period of 2007–2008 (n = 601) and
2015–2016 (n = 636)
DLHS-3
NFHS-4
Drinking water (%)
Min
0.1
32.2
Max
100
100
Mean (standard deviation)
38.12 (32.04) *
88.12 (12.54)
Moran’s I
0.72
0.56
Sanitation (%)
Min
3.1
6.9
Max
99.9
99.5
Mean (standard deviation)
44.35 (29.08) #
47.94 (22.59)
Moran’s I
0.76
0.75
Median (Q 1 ,Q 3 ) = 30.35 (8.05,69.33) * ; 37.65 (18.40,67.93) #