

Influence of Terahertz Frequency on the Elastic Constants …
83
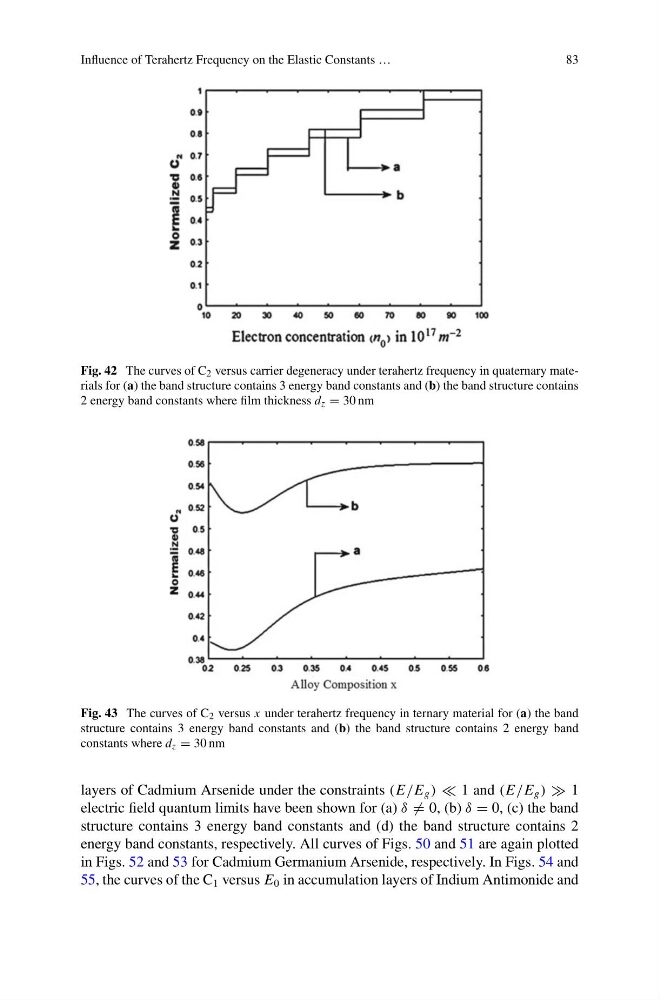
Fig. 42 The curves of C 2 versus carrier degeneracy under terahertz frequency in quaternary materials for (a) the band structure contains 3 energy band constants and (b) the band structure contains
2 energy band constants where film thickness d z = 30 nm
Fig. 43 The curves of C 2 versus x under terahertz frequency in ternary material for (a) the band
structure contains 3 energy band constants and (b) the band structure contains 2 energy band
constants where d z = 30 nm
layers of Cadmium Arsenide under the constraints (E/E g ) 1 and (E/E g ) 1
electric field quantum limits have been shown for (a) δ = 0, (b) δ = 0, (c) the band
structure contains 3 energy band constants and (d) the band structure contains 2
energy band constants, respectively. All curves of Figs. 50 and 51 are again plotted
in Figs. 52 and 53 for Cadmium Germanium Arsenide, respectively. In Figs. 54 and
55, the curves of the C 1 versus E 0 in accumulation layers of Indium Antimonide and
83
Fig. 42 The curves of C 2 versus carrier degeneracy under terahertz frequency in quaternary materials for (a) the band structure contains 3 energy band constants and (b) the band structure contains
2 energy band constants where film thickness d z = 30 nm
Fig. 43 The curves of C 2 versus x under terahertz frequency in ternary material for (a) the band
structure contains 3 energy band constants and (b) the band structure contains 2 energy band
constants where d z = 30 nm
layers of Cadmium Arsenide under the constraints (E/E g ) 1 and (E/E g ) 1
electric field quantum limits have been shown for (a) δ = 0, (b) δ = 0, (c) the band
structure contains 3 energy band constants and (d) the band structure contains 2
energy band constants, respectively. All curves of Figs. 50 and 51 are again plotted
in Figs. 52 and 53 for Cadmium Germanium Arsenide, respectively. In Figs. 54 and
55, the curves of the C 1 versus E 0 in accumulation layers of Indium Antimonide and