

82
P. K. Das et al.
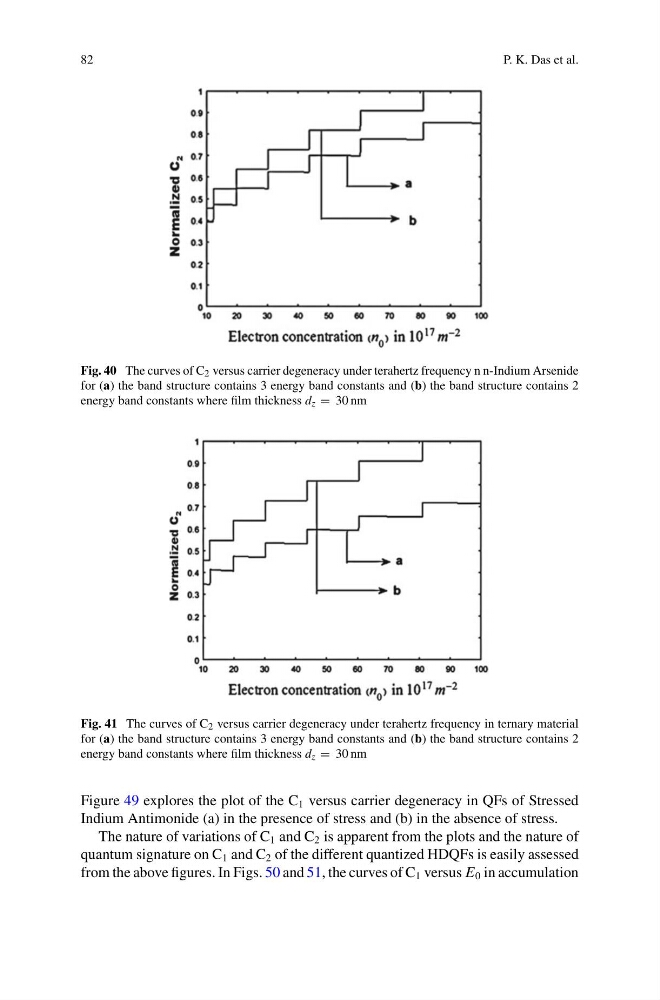
Fig. 40 The curves of C 2 versus carrier degeneracy under terahertz frequency n n-Indium Arsenide
for (a) the band structure contains 3 energy band constants and (b) the band structure contains 2
energy band constants where film thickness d z = 30 nm
Fig. 41 The curves of C 2 versus carrier degeneracy under terahertz frequency in ternary material
for (a) the band structure contains 3 energy band constants and (b) the band structure contains 2
energy band constants where film thickness d z = 30 nm
Figure 49 explores the plot of the C 1 versus carrier degeneracy in QFs of Stressed
Indium Antimonide (a) in the presence of stress and (b) in the absence of stress.
The nature of variations of C 1 and C 2 is apparent from the plots and the nature of
quantum signature on C 1 and C 2 of the different quantized HDQFs is easily assessed
from the above figures. In Figs. 50 and 51, the curves of C 1 versus E 0 in accumulation
P. K. Das et al.
Fig. 40 The curves of C 2 versus carrier degeneracy under terahertz frequency n n-Indium Arsenide
for (a) the band structure contains 3 energy band constants and (b) the band structure contains 2
energy band constants where film thickness d z = 30 nm
Fig. 41 The curves of C 2 versus carrier degeneracy under terahertz frequency in ternary material
for (a) the band structure contains 3 energy band constants and (b) the band structure contains 2
energy band constants where film thickness d z = 30 nm
Figure 49 explores the plot of the C 1 versus carrier degeneracy in QFs of Stressed
Indium Antimonide (a) in the presence of stress and (b) in the absence of stress.
The nature of variations of C 1 and C 2 is apparent from the plots and the nature of
quantum signature on C 1 and C 2 of the different quantized HDQFs is easily assessed
from the above figures. In Figs. 50 and 51, the curves of C 1 versus E 0 in accumulation