

84
3 In-Tether Chiral Center Induced Helical Peptide Modulators …
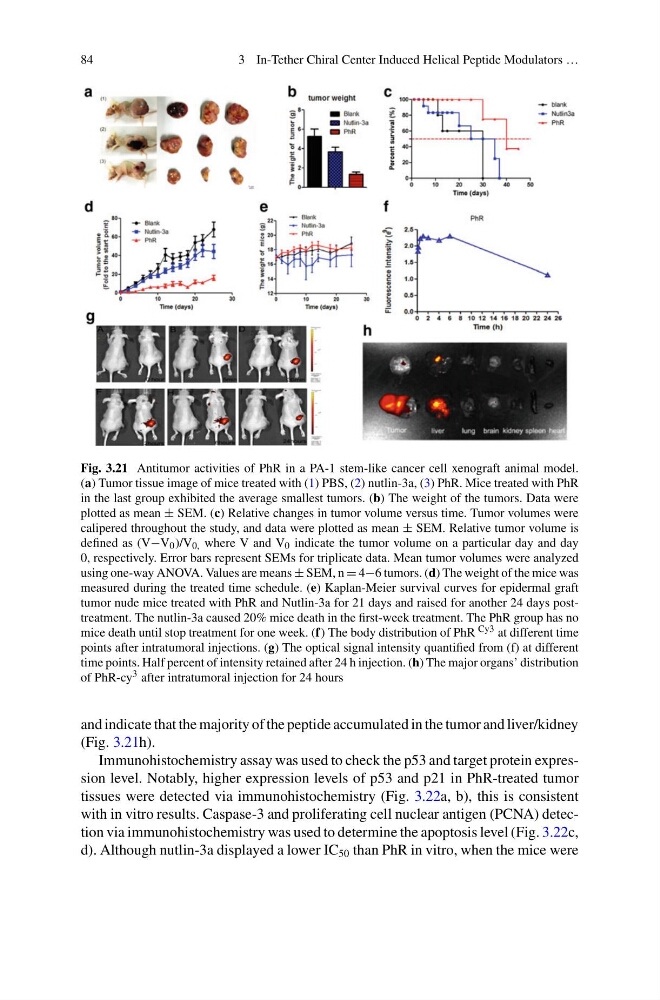
Fig. 3.21 Antitumor activities of PhR in a PA-1 stem-like cancer cell xenograft animal model.
(a) Tumor tissue image of mice treated with (1) PBS, (2) nutlin-3a, (3) PhR. Mice treated with PhR
in the last group exhibited the average smallest tumors. (b) The weight of the tumors. Data were
plotted as mean ± SEM. (c) Relative changes in tumor volume versus time. Tumor volumes were
calipered throughout the study, and data were plotted as mean ± SEM. Relative tumor volume is
defined as (V−V 0 )/V 0, where V and V 0 indicate the tumor volume on a particular day and day
0, respectively. Error bars represent SEMs for triplicate data. Mean tumor volumes were analyzed
using one-way ANOVA. Values are means ± SEM, n = 4−6 tumors. (d) The weight of the mice was
measured during the treated time schedule. (e) Kaplan-Meier survival curves for epidermal graft
tumor nude mice treated with PhR and Nutlin-3a for 21 days and raised for another 24 days posttreatment. The nutlin-3a caused 20% mice death in the first-week treatment. The PhR group has no
mice death until stop treatment for one week. (f) The body distribution of PhR Cy3 at different time
points after intratumoral injections. (g) The optical signal intensity quantified from (f) at different
time points. Half percent of intensity retained after 24 h injection. (h) The major organs’ distribution
of PhR-cy 3 after intratumoral injection for 24 hours
and indicate that the majority of the peptide accumulated in the tumor and liver/kidney
(Fig. 3.21h).
Immunohistochemistry assay was used to check the p53 and target protein expression level. Notably, higher expression levels of p53 and p21 in PhR-treated tumor
tissues were detected via immunohistochemistry (Fig. 3.22a, b), this is consistent
with in vitro results. Caspase-3 and proliferating cell nuclear antigen (PCNA) detection via immunohistochemistry was used to determine the apoptosis level (Fig. 3.22c,
d). Although nutlin-3a displayed a lower IC 50 than PhR in vitro, when the mice were
3 In-Tether Chiral Center Induced Helical Peptide Modulators …
Fig. 3.21 Antitumor activities of PhR in a PA-1 stem-like cancer cell xenograft animal model.
(a) Tumor tissue image of mice treated with (1) PBS, (2) nutlin-3a, (3) PhR. Mice treated with PhR
in the last group exhibited the average smallest tumors. (b) The weight of the tumors. Data were
plotted as mean ± SEM. (c) Relative changes in tumor volume versus time. Tumor volumes were
calipered throughout the study, and data were plotted as mean ± SEM. Relative tumor volume is
defined as (V−V 0 )/V 0, where V and V 0 indicate the tumor volume on a particular day and day
0, respectively. Error bars represent SEMs for triplicate data. Mean tumor volumes were analyzed
using one-way ANOVA. Values are means ± SEM, n = 4−6 tumors. (d) The weight of the mice was
measured during the treated time schedule. (e) Kaplan-Meier survival curves for epidermal graft
tumor nude mice treated with PhR and Nutlin-3a for 21 days and raised for another 24 days posttreatment. The nutlin-3a caused 20% mice death in the first-week treatment. The PhR group has no
mice death until stop treatment for one week. (f) The body distribution of PhR Cy3 at different time
points after intratumoral injections. (g) The optical signal intensity quantified from (f) at different
time points. Half percent of intensity retained after 24 h injection. (h) The major organs’ distribution
of PhR-cy 3 after intratumoral injection for 24 hours
and indicate that the majority of the peptide accumulated in the tumor and liver/kidney
(Fig. 3.21h).
Immunohistochemistry assay was used to check the p53 and target protein expression level. Notably, higher expression levels of p53 and p21 in PhR-treated tumor
tissues were detected via immunohistochemistry (Fig. 3.22a, b), this is consistent
with in vitro results. Caspase-3 and proliferating cell nuclear antigen (PCNA) detection via immunohistochemistry was used to determine the apoptosis level (Fig. 3.22c,
d). Although nutlin-3a displayed a lower IC 50 than PhR in vitro, when the mice were