

3.2 Results
83
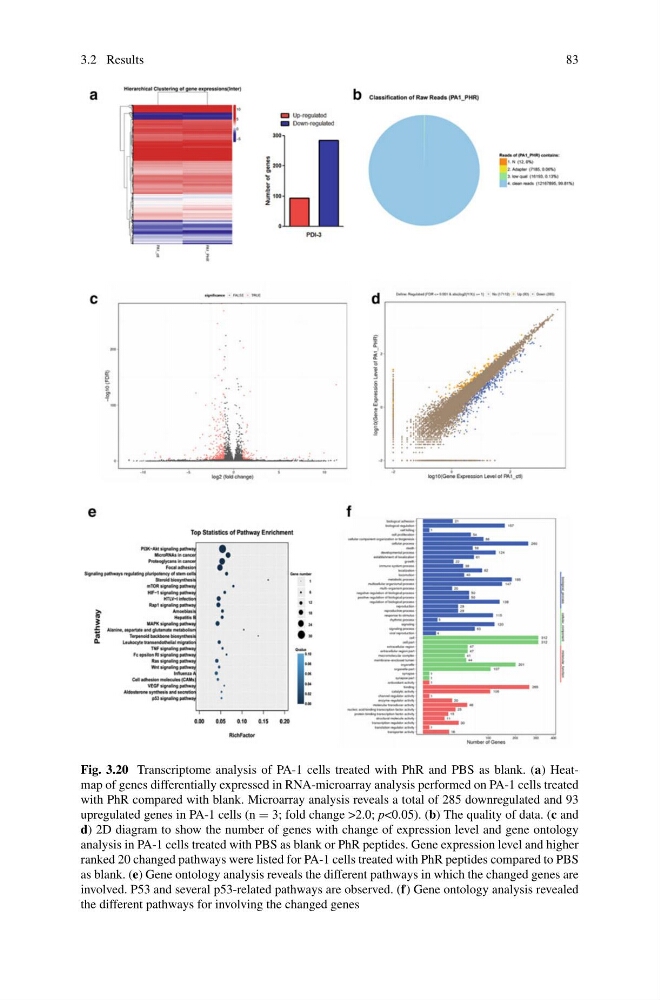
Fig. 3.20 Transcriptome analysis of PA-1 cells treated with PhR and PBS as blank. (a) Heatmap of genes differentially expressed in RNA-microarray analysis performed on PA-1 cells treated
with PhR compared with blank. Microarray analysis reveals a total of 285 downregulated and 93
upregulated genes in PA-1 cells (n = 3; fold change >2.0; p<0.05). (b) The quality of data. (c and
d) 2D diagram to show the number of genes with change of expression level and gene ontology
analysis in PA-1 cells treated with PBS as blank or PhR peptides. Gene expression level and higher
ranked 20 changed pathways were listed for PA-1 cells treated with PhR peptides compared to PBS
as blank. (e) Gene ontology analysis reveals the different pathways in which the changed genes are
involved. P53 and several p53-related pathways are observed. (f) Gene ontology analysis revealed
the different pathways for involving the changed genes
83
Fig. 3.20 Transcriptome analysis of PA-1 cells treated with PhR and PBS as blank. (a) Heatmap of genes differentially expressed in RNA-microarray analysis performed on PA-1 cells treated
with PhR compared with blank. Microarray analysis reveals a total of 285 downregulated and 93
upregulated genes in PA-1 cells (n = 3; fold change >2.0; p<0.05). (b) The quality of data. (c and
d) 2D diagram to show the number of genes with change of expression level and gene ontology
analysis in PA-1 cells treated with PBS as blank or PhR peptides. Gene expression level and higher
ranked 20 changed pathways were listed for PA-1 cells treated with PhR peptides compared to PBS
as blank. (e) Gene ontology analysis reveals the different pathways in which the changed genes are
involved. P53 and several p53-related pathways are observed. (f) Gene ontology analysis revealed
the different pathways for involving the changed genes