

78
3 In-Tether Chiral Center Induced Helical Peptide Modulators …
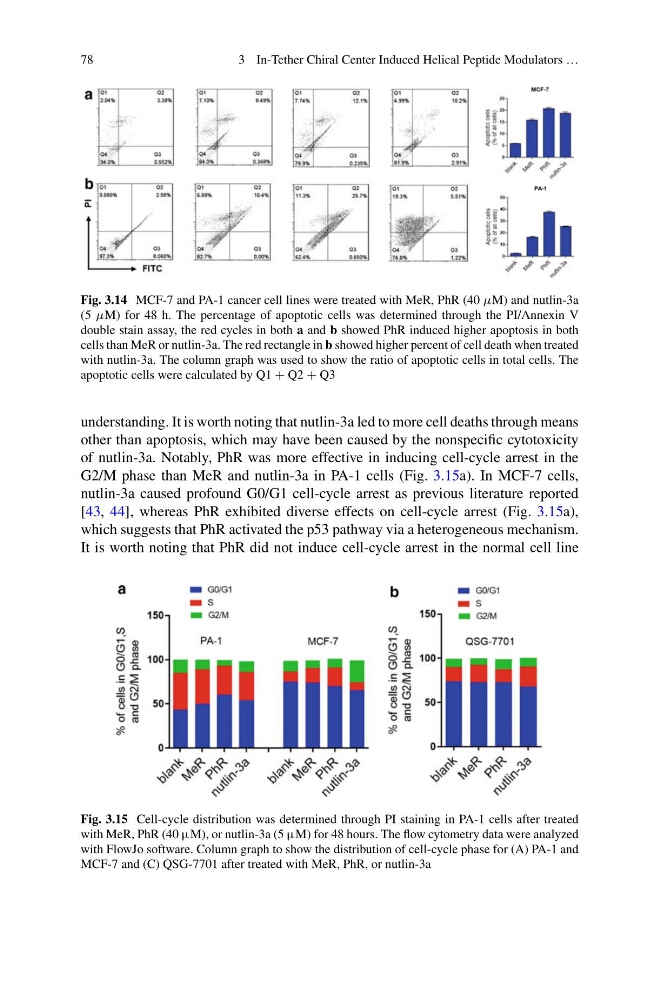
Fig. 3.14 MCF-7 and PA-1 cancer cell lines were treated with MeR, PhR (40 µM) and nutlin-3a
(5 µM) for 48 h. The percentage of apoptotic cells was determined through the PI/Annexin V
double stain assay, the red cycles in both a and b showed PhR induced higher apoptosis in both
cells than MeR or nutlin-3a. The red rectangle in b showed higher percent of cell death when treated
with nutlin-3a. The column graph was used to show the ratio of apoptotic cells in total cells. The
apoptotic cells were calculated by Q1 + Q2 + Q3
understanding. It is worth noting that nutlin-3a led to more cell deaths through means
other than apoptosis, which may have been caused by the nonspecific cytotoxicity
of nutlin-3a. Notably, PhR was more effective in inducing cell-cycle arrest in the
G2/M phase than MeR and nutlin-3a in PA-1 cells (Fig. 3.15a). In MCF-7 cells,
nutlin-3a caused profound G0/G1 cell-cycle arrest as previous literature reported
[43, 44], whereas PhR exhibited diverse effects on cell-cycle arrest (Fig. 3.15a),
which suggests that PhR activated the p53 pathway via a heterogeneous mechanism.
It is worth noting that PhR did not induce cell-cycle arrest in the normal cell line
Fig. 3.15 Cell-cycle distribution was determined through PI staining in PA-1 cells after treated
with MeR, PhR (40 μM), or nutlin-3a (5 μM) for 48 hours. The flow cytometry data were analyzed
with FlowJo software. Column graph to show the distribution of cell-cycle phase for (A) PA-1 and
MCF-7 and (C) QSG-7701 after treated with MeR, PhR, or nutlin-3a
3 In-Tether Chiral Center Induced Helical Peptide Modulators …
Fig. 3.14 MCF-7 and PA-1 cancer cell lines were treated with MeR, PhR (40 µM) and nutlin-3a
(5 µM) for 48 h. The percentage of apoptotic cells was determined through the PI/Annexin V
double stain assay, the red cycles in both a and b showed PhR induced higher apoptosis in both
cells than MeR or nutlin-3a. The red rectangle in b showed higher percent of cell death when treated
with nutlin-3a. The column graph was used to show the ratio of apoptotic cells in total cells. The
apoptotic cells were calculated by Q1 + Q2 + Q3
understanding. It is worth noting that nutlin-3a led to more cell deaths through means
other than apoptosis, which may have been caused by the nonspecific cytotoxicity
of nutlin-3a. Notably, PhR was more effective in inducing cell-cycle arrest in the
G2/M phase than MeR and nutlin-3a in PA-1 cells (Fig. 3.15a). In MCF-7 cells,
nutlin-3a caused profound G0/G1 cell-cycle arrest as previous literature reported
[43, 44], whereas PhR exhibited diverse effects on cell-cycle arrest (Fig. 3.15a),
which suggests that PhR activated the p53 pathway via a heterogeneous mechanism.
It is worth noting that PhR did not induce cell-cycle arrest in the normal cell line
Fig. 3.15 Cell-cycle distribution was determined through PI staining in PA-1 cells after treated
with MeR, PhR (40 μM), or nutlin-3a (5 μM) for 48 hours. The flow cytometry data were analyzed
with FlowJo software. Column graph to show the distribution of cell-cycle phase for (A) PA-1 and
MCF-7 and (C) QSG-7701 after treated with MeR, PhR, or nutlin-3a