

3.2 Results
73
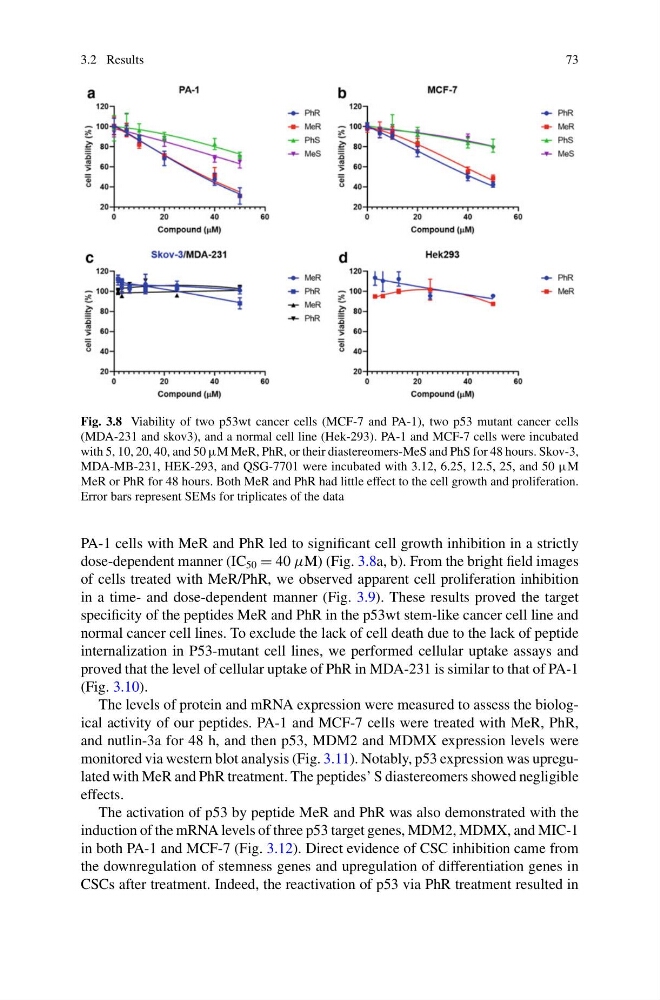
Fig. 3.8 Viability of two p53wt cancer cells (MCF-7 and PA-1), two p53 mutant cancer cells
(MDA-231 and skov3), and a normal cell line (Hek-293). PA-1 and MCF-7 cells were incubated
with 5, 10, 20, 40, and 50 μM MeR, PhR, or their diastereomers-MeS and PhS for 48 hours. Skov-3,
MDA-MB-231, HEK-293, and QSG-7701 were incubated with 3.12, 6.25, 12.5, 25, and 50 μM
MeR or PhR for 48 hours. Both MeR and PhR had little effect to the cell growth and proliferation.
Error bars represent SEMs for triplicates of the data
PA-1 cells with MeR and PhR led to significant cell growth inhibition in a strictly
dose-dependent manner (IC 50 = 40 µM) (Fig. 3.8a, b). From the bright field images
of cells treated with MeR/PhR, we observed apparent cell proliferation inhibition
in a time- and dose-dependent manner (Fig. 3.9). These results proved the target
specificity of the peptides MeR and PhR in the p53wt stem-like cancer cell line and
normal cancer cell lines. To exclude the lack of cell death due to the lack of peptide
internalization in P53-mutant cell lines, we performed cellular uptake assays and
proved that the level of cellular uptake of PhR in MDA-231 is similar to that of PA-1
(Fig. 3.10).
The levels of protein and mRNA expression were measured to assess the biological activity of our peptides. PA-1 and MCF-7 cells were treated with MeR, PhR,
and nutlin-3a for 48 h, and then p53, MDM2 and MDMX expression levels were
monitored via western blot analysis (Fig. 3.11). Notably, p53 expression was upregulated with MeR and PhR treatment. The peptides’ S diastereomers showed negligible
effects.
The activation of p53 by peptide MeR and PhR was also demonstrated with the
induction of the mRNA levels of three p53 target genes, MDM2, MDMX, and MIC-1
in both PA-1 and MCF-7 (Fig. 3.12). Direct evidence of CSC inhibition came from
the downregulation of stemness genes and upregulation of differentiation genes in
CSCs after treatment. Indeed, the reactivation of p53 via PhR treatment resulted in
73
Fig. 3.8 Viability of two p53wt cancer cells (MCF-7 and PA-1), two p53 mutant cancer cells
(MDA-231 and skov3), and a normal cell line (Hek-293). PA-1 and MCF-7 cells were incubated
with 5, 10, 20, 40, and 50 μM MeR, PhR, or their diastereomers-MeS and PhS for 48 hours. Skov-3,
MDA-MB-231, HEK-293, and QSG-7701 were incubated with 3.12, 6.25, 12.5, 25, and 50 μM
MeR or PhR for 48 hours. Both MeR and PhR had little effect to the cell growth and proliferation.
Error bars represent SEMs for triplicates of the data
PA-1 cells with MeR and PhR led to significant cell growth inhibition in a strictly
dose-dependent manner (IC 50 = 40 µM) (Fig. 3.8a, b). From the bright field images
of cells treated with MeR/PhR, we observed apparent cell proliferation inhibition
in a time- and dose-dependent manner (Fig. 3.9). These results proved the target
specificity of the peptides MeR and PhR in the p53wt stem-like cancer cell line and
normal cancer cell lines. To exclude the lack of cell death due to the lack of peptide
internalization in P53-mutant cell lines, we performed cellular uptake assays and
proved that the level of cellular uptake of PhR in MDA-231 is similar to that of PA-1
(Fig. 3.10).
The levels of protein and mRNA expression were measured to assess the biological activity of our peptides. PA-1 and MCF-7 cells were treated with MeR, PhR,
and nutlin-3a for 48 h, and then p53, MDM2 and MDMX expression levels were
monitored via western blot analysis (Fig. 3.11). Notably, p53 expression was upregulated with MeR and PhR treatment. The peptides’ S diastereomers showed negligible
effects.
The activation of p53 by peptide MeR and PhR was also demonstrated with the
induction of the mRNA levels of three p53 target genes, MDM2, MDMX, and MIC-1
in both PA-1 and MCF-7 (Fig. 3.12). Direct evidence of CSC inhibition came from
the downregulation of stemness genes and upregulation of differentiation genes in
CSCs after treatment. Indeed, the reactivation of p53 via PhR treatment resulted in