

Changes in Precipitation
Although there is a large spread between climate models, on
average, they project an increase in precipitation over the
twenty-first century alongside increased temperatures (IPCC
2013). Projected precipitation changes exceed 0.05 mm/day
and 0.15 mm/day with the RCP2.6 and RCP8.5 scenarios
respectively. These changes are far from being spatially
homogeneous and exhibit a strong seasonal variability
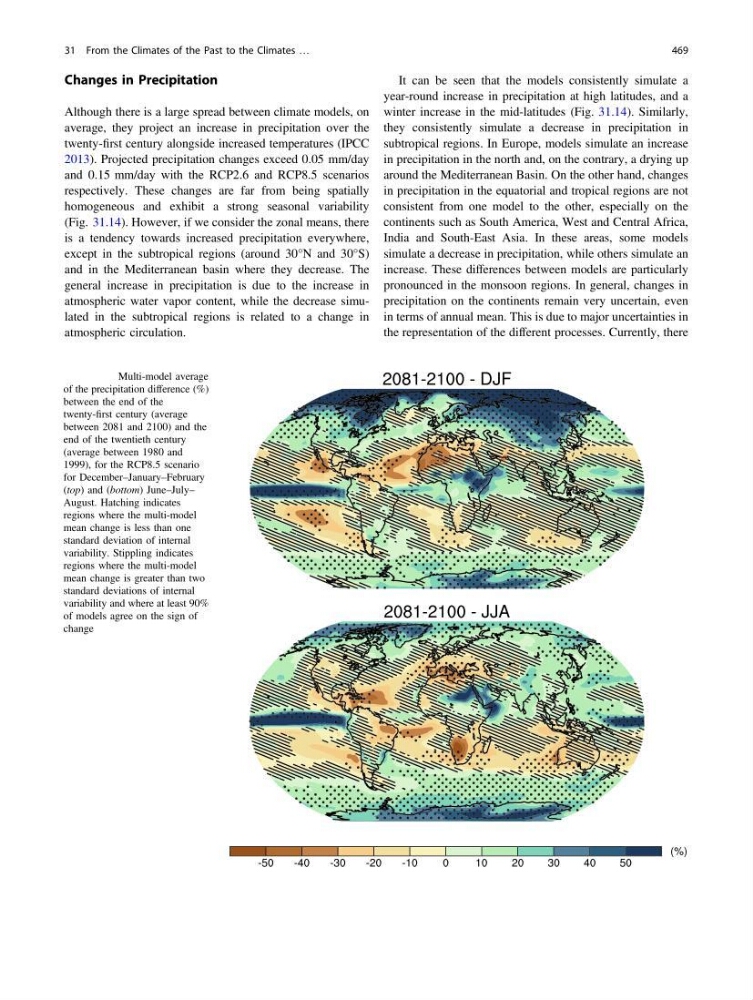
(Fig. 31.14). However, if we consider the zonal means, there
is a tendency towards increased precipitation everywhere,
except in the subtropical regions (around 30°N and 30°S)
and in the Mediterranean basin where they decrease. The
general increase in precipitation is due to the increase in
atmospheric water vapor content, while the decrease simulated in the subtropical regions is related to a change in
atmospheric circulation.
It can be seen that the models consistently simulate a
year-round increase in precipitation at high latitudes, and a
winter increase in the mid-latitudes (Fig. 31.14). Similarly,
they consistently simulate a decrease in precipitation in
subtropical regions. In Europe, models simulate an increase
in precipitation in the north and, on the contrary, a drying up
around the Mediterranean Basin. On the other hand, changes
in precipitation in the equatorial and tropical regions are not
consistent from one model to the other, especially on the
continents such as South America, West and Central Africa,
India and South-East Asia. In these areas, some models
simulate a decrease in precipitation, while others simulate an
increase. These differences between models are particularly
pronounced in the monsoon regions. In general, changes in
precipitation on the continents remain very uncertain, even
in terms of annual mean. This is due to major uncertainties in
the representation of the different processes. Currently, there
Fig. 31.14 Multi-model average
of the precipitation difference (%)
between the end of the
twenty-first century (average
between 2081 and 2100) and the
end of the twentieth century
(average between 1980 and
1999), for the RCP8.5 scenario
for December–January–February
(top) and (bottom) June–July–
August. Hatching indicates
regions where the multi-model
mean change is less than one
standard deviation of internal
variability. Stippling indicates
regions where the multi-model
mean change is greater than two
standard deviations of internal
variability and where at least 90%
of models agree on the sign of
change
31 From the Climates of the Past to the Climates …
469
Although there is a large spread between climate models, on
average, they project an increase in precipitation over the
twenty-first century alongside increased temperatures (IPCC
2013). Projected precipitation changes exceed 0.05 mm/day
and 0.15 mm/day with the RCP2.6 and RCP8.5 scenarios
respectively. These changes are far from being spatially
homogeneous and exhibit a strong seasonal variability
(Fig. 31.14). However, if we consider the zonal means, there
is a tendency towards increased precipitation everywhere,
except in the subtropical regions (around 30°N and 30°S)
and in the Mediterranean basin where they decrease. The
general increase in precipitation is due to the increase in
atmospheric water vapor content, while the decrease simulated in the subtropical regions is related to a change in
atmospheric circulation.
It can be seen that the models consistently simulate a
year-round increase in precipitation at high latitudes, and a
winter increase in the mid-latitudes (Fig. 31.14). Similarly,
they consistently simulate a decrease in precipitation in
subtropical regions. In Europe, models simulate an increase
in precipitation in the north and, on the contrary, a drying up
around the Mediterranean Basin. On the other hand, changes
in precipitation in the equatorial and tropical regions are not
consistent from one model to the other, especially on the
continents such as South America, West and Central Africa,
India and South-East Asia. In these areas, some models
simulate a decrease in precipitation, while others simulate an
increase. These differences between models are particularly
pronounced in the monsoon regions. In general, changes in
precipitation on the continents remain very uncertain, even
in terms of annual mean. This is due to major uncertainties in
the representation of the different processes. Currently, there
Fig. 31.14 Multi-model average
of the precipitation difference (%)
between the end of the
twenty-first century (average
between 2081 and 2100) and the
end of the twentieth century
(average between 1980 and
1999), for the RCP8.5 scenario
for December–January–February
(top) and (bottom) June–July–
August. Hatching indicates
regions where the multi-model
mean change is less than one
standard deviation of internal
variability. Stippling indicates
regions where the multi-model
mean change is greater than two
standard deviations of internal
variability and where at least 90%
of models agree on the sign of
change
31 From the Climates of the Past to the Climates …
469