

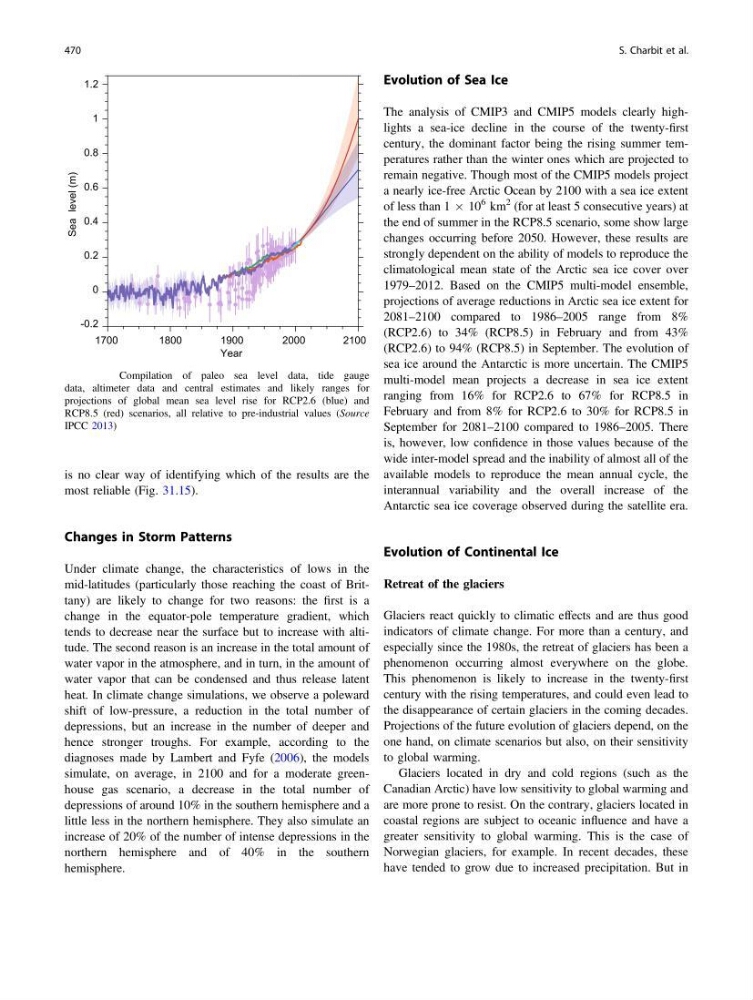
is no clear way of identifying which of the results are the
most reliable (Fig. 31.15).
Changes in Storm Patterns
Under climate change, the characteristics of lows in the
mid-latitudes (particularly those reaching the coast of Brittany) are likely to change for two reasons: the first is a
change in the equator-pole temperature gradient, which
tends to decrease near the surface but to increase with altitude. The second reason is an increase in the total amount of
water vapor in the atmosphere, and in turn, in the amount of
water vapor that can be condensed and thus release latent
heat. In climate change simulations, we observe a poleward
shift of low-pressure, a reduction in the total number of
depressions, but an increase in the number of deeper and
hence stronger troughs. For example, according to the
diagnoses made by Lambert and Fyfe (2006), the models
simulate, on average, in 2100 and for a moderate greenhouse gas scenario, a decrease in the total number of
depressions of around 10% in the southern hemisphere and a
little less in the northern hemisphere. They also simulate an
increase of 20% of the number of intense depressions in the
northern hemisphere and of 40% in the southern
hemisphere.
Evolution of Sea Ice
The analysis of CMIP3 and CMIP5 models clearly highlights a sea-ice decline in the course of the twenty-first
century, the dominant factor being the rising summer temperatures rather than the winter ones which are projected to
remain negative. Though most of the CMIP5 models project
a nearly ice-free Arctic Ocean by 2100 with a sea ice extent
of less than 1 Â 10
6 km
2 (for at least 5 consecutive years) at
the end of summer in the RCP8.5 scenario, some show large
changes occurring before 2050. However, these results are
strongly dependent on the ability of models to reproduce the
climatological mean state of the Arctic sea ice cover over
1979–2012. Based on the CMIP5 multi-model ensemble,
projections of average reductions in Arctic sea ice extent for
2081–2100 compared to 1986–2005 range from 8%
(RCP2.6) to 34% (RCP8.5) in February and from 43%
(RCP2.6) to 94% (RCP8.5) in September. The evolution of
sea ice around the Antarctic is more uncertain. The CMIP5
multi-model mean projects a decrease in sea ice extent
ranging from 16% for RCP2.6 to 67% for RCP8.5 in
February and from 8% for RCP2.6 to 30% for RCP8.5 in
September for 2081–2100 compared to 1986–2005. There
is, however, low confidence in those values because of the
wide inter-model spread and the inability of almost all of the
available models to reproduce the mean annual cycle, the
interannual variability and the overall increase of the
Antarctic sea ice coverage observed during the satellite era.
Evolution of Continental Ice
Retreat of the glaciers
Glaciers react quickly to climatic effects and are thus good
indicators of climate change. For more than a century, and
especially since the 1980s, the retreat of glaciers has been a
phenomenon occurring almost everywhere on the globe.
This phenomenon is likely to increase in the twenty-first
century with the rising temperatures, and could even lead to
the disappearance of certain glaciers in the coming decades.
Projections of the future evolution of glaciers depend, on the
one hand, on climate scenarios but also, on their sensitivity
to global warming.
Glaciers located in dry and cold regions (such as the
Canadian Arctic) have low sensitivity to global warming and
are more prone to resist. On the contrary, glaciers located in
coastal regions are subject to oceanic influence and have a
greater sensitivity to global warming. This is the case of
Norwegian glaciers, for example. In recent decades, these
have tended to grow due to increased precipitation. But in
Fig. 31.15 Compilation of paleo sea level data, tide gauge
data, altimeter data and central estimates and likely ranges for
projections of global mean sea level rise for RCP2.6 (blue) and
RCP8.5 (red) scenarios, all relative to pre-industrial values (Source
IPCC 2013)
470
S. Charbit et al.
most reliable (Fig. 31.15).
Changes in Storm Patterns
Under climate change, the characteristics of lows in the
mid-latitudes (particularly those reaching the coast of Brittany) are likely to change for two reasons: the first is a
change in the equator-pole temperature gradient, which
tends to decrease near the surface but to increase with altitude. The second reason is an increase in the total amount of
water vapor in the atmosphere, and in turn, in the amount of
water vapor that can be condensed and thus release latent
heat. In climate change simulations, we observe a poleward
shift of low-pressure, a reduction in the total number of
depressions, but an increase in the number of deeper and
hence stronger troughs. For example, according to the
diagnoses made by Lambert and Fyfe (2006), the models
simulate, on average, in 2100 and for a moderate greenhouse gas scenario, a decrease in the total number of
depressions of around 10% in the southern hemisphere and a
little less in the northern hemisphere. They also simulate an
increase of 20% of the number of intense depressions in the
northern hemisphere and of 40% in the southern
hemisphere.
Evolution of Sea Ice
The analysis of CMIP3 and CMIP5 models clearly highlights a sea-ice decline in the course of the twenty-first
century, the dominant factor being the rising summer temperatures rather than the winter ones which are projected to
remain negative. Though most of the CMIP5 models project
a nearly ice-free Arctic Ocean by 2100 with a sea ice extent
of less than 1 Â 10
6 km
2 (for at least 5 consecutive years) at
the end of summer in the RCP8.5 scenario, some show large
changes occurring before 2050. However, these results are
strongly dependent on the ability of models to reproduce the
climatological mean state of the Arctic sea ice cover over
1979–2012. Based on the CMIP5 multi-model ensemble,
projections of average reductions in Arctic sea ice extent for
2081–2100 compared to 1986–2005 range from 8%
(RCP2.6) to 34% (RCP8.5) in February and from 43%
(RCP2.6) to 94% (RCP8.5) in September. The evolution of
sea ice around the Antarctic is more uncertain. The CMIP5
multi-model mean projects a decrease in sea ice extent
ranging from 16% for RCP2.6 to 67% for RCP8.5 in
February and from 8% for RCP2.6 to 30% for RCP8.5 in
September for 2081–2100 compared to 1986–2005. There
is, however, low confidence in those values because of the
wide inter-model spread and the inability of almost all of the
available models to reproduce the mean annual cycle, the
interannual variability and the overall increase of the
Antarctic sea ice coverage observed during the satellite era.
Evolution of Continental Ice
Retreat of the glaciers
Glaciers react quickly to climatic effects and are thus good
indicators of climate change. For more than a century, and
especially since the 1980s, the retreat of glaciers has been a
phenomenon occurring almost everywhere on the globe.
This phenomenon is likely to increase in the twenty-first
century with the rising temperatures, and could even lead to
the disappearance of certain glaciers in the coming decades.
Projections of the future evolution of glaciers depend, on the
one hand, on climate scenarios but also, on their sensitivity
to global warming.
Glaciers located in dry and cold regions (such as the
Canadian Arctic) have low sensitivity to global warming and
are more prone to resist. On the contrary, glaciers located in
coastal regions are subject to oceanic influence and have a
greater sensitivity to global warming. This is the case of
Norwegian glaciers, for example. In recent decades, these
have tended to grow due to increased precipitation. But in
Fig. 31.15 Compilation of paleo sea level data, tide gauge
data, altimeter data and central estimates and likely ranges for
projections of global mean sea level rise for RCP2.6 (blue) and
RCP8.5 (red) scenarios, all relative to pre-industrial values (Source
IPCC 2013)
470
S. Charbit et al.