

warming of the water is a decrease in the capacity of the
ocean to absorb CO 2 , and a biological effect is a modification
in the distribution of species due to environmental changes
(salinity, temperature) which can cause transformations in the
trophic chain and therefore in the biological pump. In terms
of CO 2 sinks, it is now known that for two CO 2 molecules
emitted, only one remains in the atmospheric reservoir while
the other is stored either in the terrestrial biosphere or in the
ocean. This ratio is the result of many processes involved in
the regulation of the carbon cycle; therefore, due to the
anthropogenic perturbation it is expected to vary. The
capacity of continents to store carbon can change either
gradually or abruptly. For example, permafrost thawing in
Siberia would release the equivalent of an additional
100 ppm of CO 2 at least into the atmosphere. As for the
biological pump, this will depend on how life functions and
adapts in a warming world, which is not easy to predict.
Climate Projections for 2100: What
the Models Say: Main Climate Characteristics
In this section, the results are derived, unless otherwise
indicated, from simulations performed by the forty or so
coupled atmosphere-ocean general circulation models (or
climate models) that contributed to the CMIP5 exercise. The
values given below are the average of the models ± 1
standard deviation.
The Amplitude of the Warming
In response to both anthropogenic (greenhouse gases and
aerosols) and natural (volcanoes and solar intensity) forcings, the models simulate an average global increase in air
temperature near the surface of about 0.8 °C between the
beginning and the end of the twentieth century, consistent
with observed measurements. Sensitivity studies, with different forcings, have shown that this warming is mainly due
to anthropogenic forcings. Today, the climate system is out
of balance; if the concentrations of greenhouse gases and
aerosols were maintained at their 2000 values, the climate
would continue to warm by around 0.4 °C through the
twenty-first century. However, the simulated increase in
temperature depends above all on the emission scenarios.
Indeed over twenty models, when the concentration of
greenhouse gases is prescribed, there is on average a variation of a little less than 1 °C for the RCP2.6 scenario and of
4 °C for the RCP8.5 scenario (Fig. 31.12). The dispersion of
the simulated warming by the different models at the end of
the century is ± 0.5 °C, the main reasons for which are
outlined in Sect. “Climate Response to a Doubling of CO 2 :
Forcings and Feedbacks” of this chapter.
Geographical Distribution of Temperature
Changes
The geographical distribution of the temperature increase is
roughly similar for the different scenarios (although the
amplitudes are very different). Figure 31.13 illustrates the
RCP2.6 and RCP8.5 scenarios. It shows results that are now
well established: the temperature increase is higher on land
than on the oceans, and is particularly strong in the high
latitudes of the northern hemisphere.
In the tropics, the greater increase in temperature over land
than over ocean is partly explained by changes in
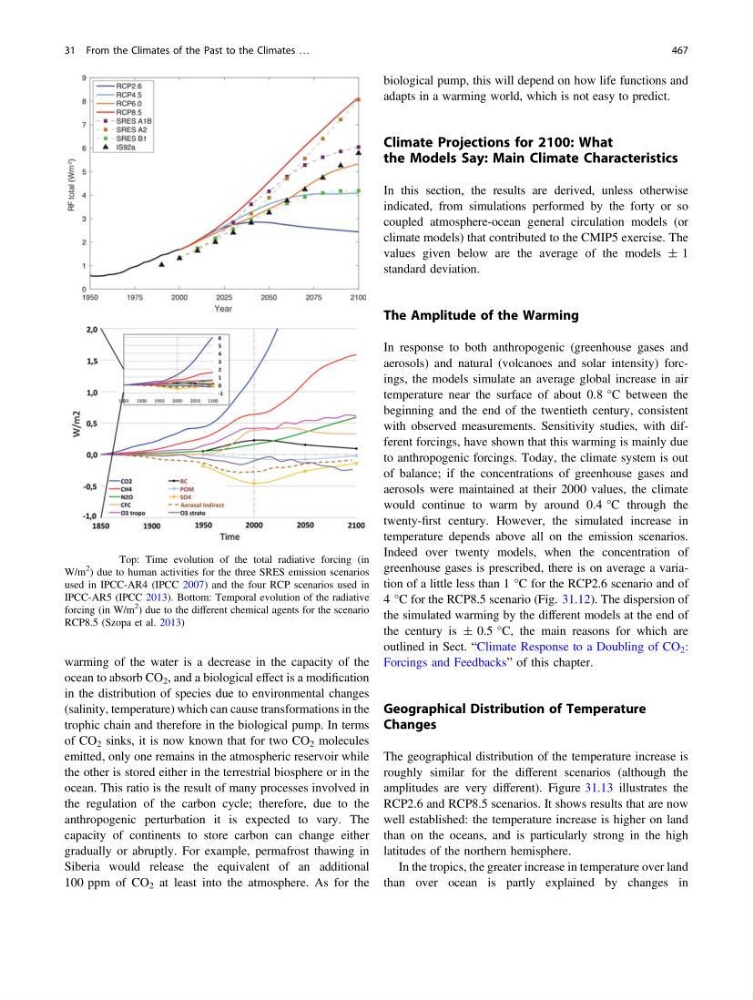
Fig. 31.11 Top: Time evolution of the total radiative forcing (in
W/m
2
) due to human activities for the three SRES emission scenarios
used in IPCC-AR4 (IPCC 2007) and the four RCP scenarios used in
IPCC-AR5 (IPCC 2013). Bottom: Temporal evolution of the radiative
forcing (in W/m
2
) due to the different chemical agents for the scenario
RCP8.5 (Szopa et al. 2013)
31 From the Climates of the Past to the Climates …
467
ocean to absorb CO 2 , and a biological effect is a modification
in the distribution of species due to environmental changes
(salinity, temperature) which can cause transformations in the
trophic chain and therefore in the biological pump. In terms
of CO 2 sinks, it is now known that for two CO 2 molecules
emitted, only one remains in the atmospheric reservoir while
the other is stored either in the terrestrial biosphere or in the
ocean. This ratio is the result of many processes involved in
the regulation of the carbon cycle; therefore, due to the
anthropogenic perturbation it is expected to vary. The
capacity of continents to store carbon can change either
gradually or abruptly. For example, permafrost thawing in
Siberia would release the equivalent of an additional
100 ppm of CO 2 at least into the atmosphere. As for the
biological pump, this will depend on how life functions and
adapts in a warming world, which is not easy to predict.
Climate Projections for 2100: What
the Models Say: Main Climate Characteristics
In this section, the results are derived, unless otherwise
indicated, from simulations performed by the forty or so
coupled atmosphere-ocean general circulation models (or
climate models) that contributed to the CMIP5 exercise. The
values given below are the average of the models ± 1
standard deviation.
The Amplitude of the Warming
In response to both anthropogenic (greenhouse gases and
aerosols) and natural (volcanoes and solar intensity) forcings, the models simulate an average global increase in air
temperature near the surface of about 0.8 °C between the
beginning and the end of the twentieth century, consistent
with observed measurements. Sensitivity studies, with different forcings, have shown that this warming is mainly due
to anthropogenic forcings. Today, the climate system is out
of balance; if the concentrations of greenhouse gases and
aerosols were maintained at their 2000 values, the climate
would continue to warm by around 0.4 °C through the
twenty-first century. However, the simulated increase in
temperature depends above all on the emission scenarios.
Indeed over twenty models, when the concentration of
greenhouse gases is prescribed, there is on average a variation of a little less than 1 °C for the RCP2.6 scenario and of
4 °C for the RCP8.5 scenario (Fig. 31.12). The dispersion of
the simulated warming by the different models at the end of
the century is ± 0.5 °C, the main reasons for which are
outlined in Sect. “Climate Response to a Doubling of CO 2 :
Forcings and Feedbacks” of this chapter.
Geographical Distribution of Temperature
Changes
The geographical distribution of the temperature increase is
roughly similar for the different scenarios (although the
amplitudes are very different). Figure 31.13 illustrates the
RCP2.6 and RCP8.5 scenarios. It shows results that are now
well established: the temperature increase is higher on land
than on the oceans, and is particularly strong in the high
latitudes of the northern hemisphere.
In the tropics, the greater increase in temperature over land
than over ocean is partly explained by changes in
Fig. 31.11 Top: Time evolution of the total radiative forcing (in
W/m
2
) due to human activities for the three SRES emission scenarios
used in IPCC-AR4 (IPCC 2007) and the four RCP scenarios used in
IPCC-AR5 (IPCC 2013). Bottom: Temporal evolution of the radiative
forcing (in W/m
2
) due to the different chemical agents for the scenario
RCP8.5 (Szopa et al. 2013)
31 From the Climates of the Past to the Climates …
467