

applicable at that time, and that the types of stationary circulation observed today were not present then.
The Equatorial Pacific (ENSO)
El Niño events are a major manifestation of the coupled
ocean-atmosphere variability of tropical regions originating
in the Pacific Ocean (Philander 1990). The normal conditions of the Pacific Ocean are characterized by the ‘warm
pool’ (using the language of climatologists) in the western
part of the basin and by the development of an upwelling in
the eastern part, brought about by the divergence of the
southeast trade wind and, closer to the coast, by the meridian
component of the northerly wind along the coast of South
America, which favors the development of a coastal
upwelling.
The El Niño years are characterized by abnormally warm
waters between the date line and the South American coast,
and are accompanied by a weakening of the temperature
gradient across the Pacific basin (Fig. 30.11).
These oceanic structures are strongly linked to the
atmosphere and to the southern oscillation and modulate the
intensity of the trade winds, large-scale tropical circulation
and precipitation. El Niño occurs every three to seven years
and alternates with La Niña periods, which, on the contrary
introduces cold conditions in the eastern equatorial Pacific.
The impact of El Niño events is not limited to equatorial
regions and spreads to mid-latitudes via an atmospheric
wave train. Nevertheless, the intensity and frequency of
these events, as well as the links between ENSO (El
Niño-Southern Oscillation) variability and the average climate state, are still poorly understood.
The Holocene is a period of particular interest to understand these different aspects. Variations in the frequency and
intensity of El Niño events for this period were recorded in
corals, tropical glaciers and lake sediments. The different
studies are in agreement that El Niño events were less
intense during most of the Holocene and that the recent
period is unusual in this context (Cobb et al. 2013; Carre
et al. 2014; Emile-Geay et al. 2016). Although all modeling
studies agree on this reduction in activity in the Mid
NAO−
−10
−8
−6
−4
−2
0
0
2
4
6
8
−80
−60
−40
−20
0
20
40
30
40
50
60
70
Atlantic Ridge
−6
−4
−2
0
0
0
2
4
6
8
10
−80
−60
−40
−20
0
20
40
30
40
50
60
70
Blocking
−2
0
0
2
4
6
8
10
−80
−60
−40
−20
0
20
40
30
40
50
60
70
NAO+
−12
−10
−8
−6
−4
−2
0
2
4
−80
−60
−40
−20
0
20
40
30
40
50
60
70
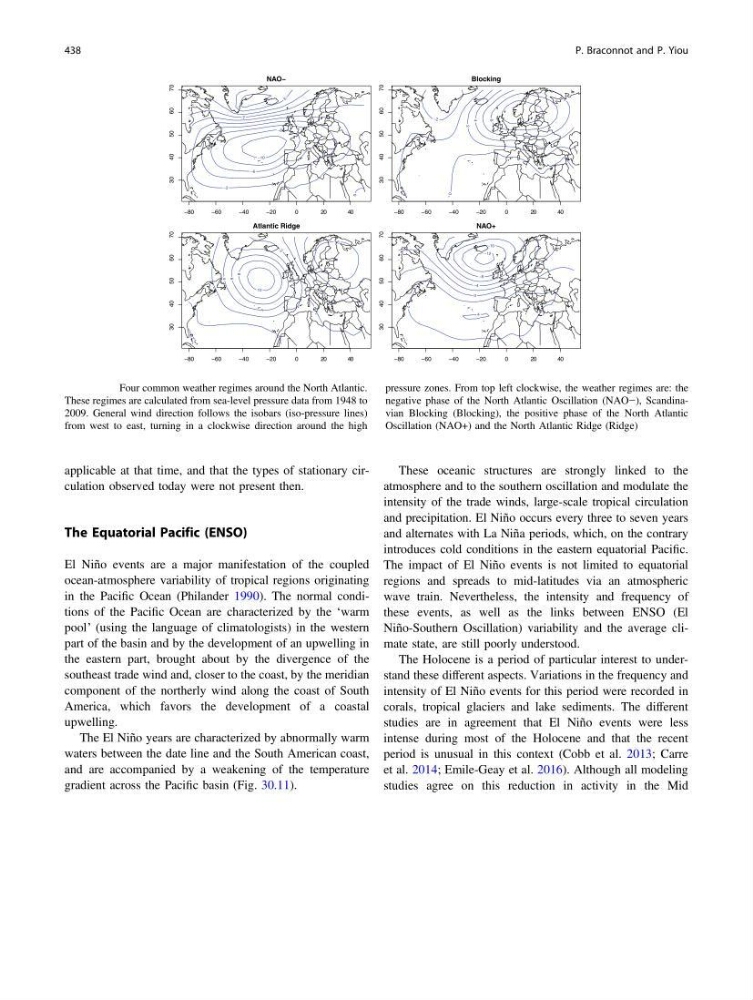
Fig. 30.10 Four common weather regimes around the North Atlantic.
These regimes are calculated from sea-level pressure data from 1948 to
2009. General wind direction follows the isobars (iso-pressure lines)
from west to east, turning in a clockwise direction around the high
pressure zones. From top left clockwise, the weather regimes are: the
negative phase of the North Atlantic Oscillation (NAO−), Scandinavian Blocking (Blocking), the positive phase of the North Atlantic
Oscillation (NAO+) and the North Atlantic Ridge (Ridge)
438
P. Braconnot and P. Yiou
The Equatorial Pacific (ENSO)
El Niño events are a major manifestation of the coupled
ocean-atmosphere variability of tropical regions originating
in the Pacific Ocean (Philander 1990). The normal conditions of the Pacific Ocean are characterized by the ‘warm
pool’ (using the language of climatologists) in the western
part of the basin and by the development of an upwelling in
the eastern part, brought about by the divergence of the
southeast trade wind and, closer to the coast, by the meridian
component of the northerly wind along the coast of South
America, which favors the development of a coastal
upwelling.
The El Niño years are characterized by abnormally warm
waters between the date line and the South American coast,
and are accompanied by a weakening of the temperature
gradient across the Pacific basin (Fig. 30.11).
These oceanic structures are strongly linked to the
atmosphere and to the southern oscillation and modulate the
intensity of the trade winds, large-scale tropical circulation
and precipitation. El Niño occurs every three to seven years
and alternates with La Niña periods, which, on the contrary
introduces cold conditions in the eastern equatorial Pacific.
The impact of El Niño events is not limited to equatorial
regions and spreads to mid-latitudes via an atmospheric
wave train. Nevertheless, the intensity and frequency of
these events, as well as the links between ENSO (El
Niño-Southern Oscillation) variability and the average climate state, are still poorly understood.
The Holocene is a period of particular interest to understand these different aspects. Variations in the frequency and
intensity of El Niño events for this period were recorded in
corals, tropical glaciers and lake sediments. The different
studies are in agreement that El Niño events were less
intense during most of the Holocene and that the recent
period is unusual in this context (Cobb et al. 2013; Carre
et al. 2014; Emile-Geay et al. 2016). Although all modeling
studies agree on this reduction in activity in the Mid
NAO−
−10
−8
−6
−4
−2
0
0
2
4
6
8
−80
−60
−40
−20
0
20
40
30
40
50
60
70
Atlantic Ridge
−6
−4
−2
0
0
0
2
4
6
8
10
−80
−60
−40
−20
0
20
40
30
40
50
60
70
Blocking
−2
0
0
2
4
6
8
10
−80
−60
−40
−20
0
20
40
30
40
50
60
70
NAO+
−12
−10
−8
−6
−4
−2
0
2
4
−80
−60
−40
−20
0
20
40
30
40
50
60
70
Fig. 30.10 Four common weather regimes around the North Atlantic.
These regimes are calculated from sea-level pressure data from 1948 to
2009. General wind direction follows the isobars (iso-pressure lines)
from west to east, turning in a clockwise direction around the high
pressure zones. From top left clockwise, the weather regimes are: the
negative phase of the North Atlantic Oscillation (NAO−), Scandinavian Blocking (Blocking), the positive phase of the North Atlantic
Oscillation (NAO+) and the North Atlantic Ridge (Ridge)
438
P. Braconnot and P. Yiou