

This temperature structure is related to fluctuations in the
atmospheric circulation in the extra-tropics of the northern
hemisphere. Theoretically, this circulation blows from west
to east between 30° N and 70° N, and is diverted to the
north by the Coriolis force (due to the rotation of the Earth).
The North Atlantic has a characteristic zone of low pressure
(depression) around Iceland and a zone of high pressure
(anticyclone) around the Azores. It is the modulation of the
respective influences of these two phenomena that is at the
origin of the NAO.
At the level of the North Atlantic basin, the atmospheric
flow (of density q) is governed by an equilibrium between
the pressure forces (P) and the Coriolis force (f perpendicular
to the movement). It is the geostrophic equilibrium which is
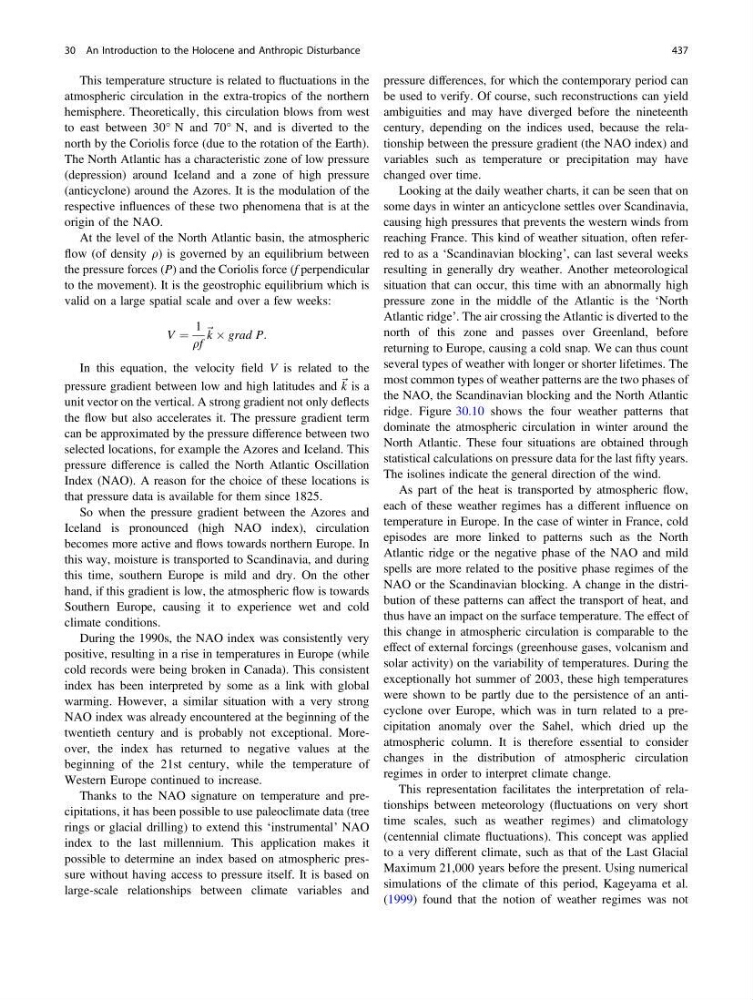
valid on a large spatial scale and over a few weeks:
V ¼
1
qf
~ k  grad P:
In this equation, the velocity field V is related to the
pressure gradient between low and high latitudes and ~ k is a
unit vector on the vertical. A strong gradient not only deflects
the flow but also accelerates it. The pressure gradient term
can be approximated by the pressure difference between two
selected locations, for example the Azores and Iceland. This
pressure difference is called the North Atlantic Oscillation
Index (NAO). A reason for the choice of these locations is
that pressure data is available for them since 1825.
So when the pressure gradient between the Azores and
Iceland is pronounced (high NAO index), circulation
becomes more active and flows towards northern Europe. In
this way, moisture is transported to Scandinavia, and during
this time, southern Europe is mild and dry. On the other
hand, if this gradient is low, the atmospheric flow is towards
Southern Europe, causing it to experience wet and cold
climate conditions.
During the 1990s, the NAO index was consistently very
positive, resulting in a rise in temperatures in Europe (while
cold records were being broken in Canada). This consistent
index has been interpreted by some as a link with global
warming. However, a similar situation with a very strong
NAO index was already encountered at the beginning of the
twentieth century and is probably not exceptional. Moreover, the index has returned to negative values at the
beginning of the 21st century, while the temperature of
Western Europe continued to increase.
Thanks to the NAO signature on temperature and precipitations, it has been possible to use paleoclimate data (tree
rings or glacial drilling) to extend this ‘instrumental’ NAO
index to the last millennium. This application makes it
possible to determine an index based on atmospheric pressure without having access to pressure itself. It is based on
large-scale relationships between climate variables and
pressure differences, for which the contemporary period can
be used to verify. Of course, such reconstructions can yield
ambiguities and may have diverged before the nineteenth
century, depending on the indices used, because the relationship between the pressure gradient (the NAO index) and
variables such as temperature or precipitation may have
changed over time.
Looking at the daily weather charts, it can be seen that on
some days in winter an anticyclone settles over Scandinavia,
causing high pressures that prevents the western winds from
reaching France. This kind of weather situation, often referred to as a ‘Scandinavian blocking’, can last several weeks
resulting in generally dry weather. Another meteorological
situation that can occur, this time with an abnormally high
pressure zone in the middle of the Atlantic is the ‘North
Atlantic ridge’. The air crossing the Atlantic is diverted to the
north of this zone and passes over Greenland, before
returning to Europe, causing a cold snap. We can thus count
several types of weather with longer or shorter lifetimes. The
most common types of weather patterns are the two phases of
the NAO, the Scandinavian blocking and the North Atlantic
ridge. Figure 30.10 shows the four weather patterns that
dominate the atmospheric circulation in winter around the
North Atlantic. These four situations are obtained through
statistical calculations on pressure data for the last fifty years.
The isolines indicate the general direction of the wind.
As part of the heat is transported by atmospheric flow,
each of these weather regimes has a different influence on
temperature in Europe. In the case of winter in France, cold
episodes are more linked to patterns such as the North
Atlantic ridge or the negative phase of the NAO and mild
spells are more related to the positive phase regimes of the
NAO or the Scandinavian blocking. A change in the distribution of these patterns can affect the transport of heat, and
thus have an impact on the surface temperature. The effect of
this change in atmospheric circulation is comparable to the
effect of external forcings (greenhouse gases, volcanism and
solar activity) on the variability of temperatures. During the
exceptionally hot summer of 2003, these high temperatures
were shown to be partly due to the persistence of an anticyclone over Europe, which was in turn related to a precipitation anomaly over the Sahel, which dried up the
atmospheric column. It is therefore essential to consider
changes in the distribution of atmospheric circulation
regimes in order to interpret climate change.
This representation facilitates the interpretation of relationships between meteorology (fluctuations on very short
time scales, such as weather regimes) and climatology
(centennial climate fluctuations). This concept was applied
to a very different climate, such as that of the Last Glacial
Maximum 21,000 years before the present. Using numerical
simulations of the climate of this period, Kageyama et al.
(1999) found that the notion of weather regimes was not
30 An Introduction to the Holocene and Anthropic Disturbance
437
atmospheric circulation in the extra-tropics of the northern
hemisphere. Theoretically, this circulation blows from west
to east between 30° N and 70° N, and is diverted to the
north by the Coriolis force (due to the rotation of the Earth).
The North Atlantic has a characteristic zone of low pressure
(depression) around Iceland and a zone of high pressure
(anticyclone) around the Azores. It is the modulation of the
respective influences of these two phenomena that is at the
origin of the NAO.
At the level of the North Atlantic basin, the atmospheric
flow (of density q) is governed by an equilibrium between
the pressure forces (P) and the Coriolis force (f perpendicular
to the movement). It is the geostrophic equilibrium which is
valid on a large spatial scale and over a few weeks:
V ¼
1
qf
~ k  grad P:
In this equation, the velocity field V is related to the
pressure gradient between low and high latitudes and ~ k is a
unit vector on the vertical. A strong gradient not only deflects
the flow but also accelerates it. The pressure gradient term
can be approximated by the pressure difference between two
selected locations, for example the Azores and Iceland. This
pressure difference is called the North Atlantic Oscillation
Index (NAO). A reason for the choice of these locations is
that pressure data is available for them since 1825.
So when the pressure gradient between the Azores and
Iceland is pronounced (high NAO index), circulation
becomes more active and flows towards northern Europe. In
this way, moisture is transported to Scandinavia, and during
this time, southern Europe is mild and dry. On the other
hand, if this gradient is low, the atmospheric flow is towards
Southern Europe, causing it to experience wet and cold
climate conditions.
During the 1990s, the NAO index was consistently very
positive, resulting in a rise in temperatures in Europe (while
cold records were being broken in Canada). This consistent
index has been interpreted by some as a link with global
warming. However, a similar situation with a very strong
NAO index was already encountered at the beginning of the
twentieth century and is probably not exceptional. Moreover, the index has returned to negative values at the
beginning of the 21st century, while the temperature of
Western Europe continued to increase.
Thanks to the NAO signature on temperature and precipitations, it has been possible to use paleoclimate data (tree
rings or glacial drilling) to extend this ‘instrumental’ NAO
index to the last millennium. This application makes it
possible to determine an index based on atmospheric pressure without having access to pressure itself. It is based on
large-scale relationships between climate variables and
pressure differences, for which the contemporary period can
be used to verify. Of course, such reconstructions can yield
ambiguities and may have diverged before the nineteenth
century, depending on the indices used, because the relationship between the pressure gradient (the NAO index) and
variables such as temperature or precipitation may have
changed over time.
Looking at the daily weather charts, it can be seen that on
some days in winter an anticyclone settles over Scandinavia,
causing high pressures that prevents the western winds from
reaching France. This kind of weather situation, often referred to as a ‘Scandinavian blocking’, can last several weeks
resulting in generally dry weather. Another meteorological
situation that can occur, this time with an abnormally high
pressure zone in the middle of the Atlantic is the ‘North
Atlantic ridge’. The air crossing the Atlantic is diverted to the
north of this zone and passes over Greenland, before
returning to Europe, causing a cold snap. We can thus count
several types of weather with longer or shorter lifetimes. The
most common types of weather patterns are the two phases of
the NAO, the Scandinavian blocking and the North Atlantic
ridge. Figure 30.10 shows the four weather patterns that
dominate the atmospheric circulation in winter around the
North Atlantic. These four situations are obtained through
statistical calculations on pressure data for the last fifty years.
The isolines indicate the general direction of the wind.
As part of the heat is transported by atmospheric flow,
each of these weather regimes has a different influence on
temperature in Europe. In the case of winter in France, cold
episodes are more linked to patterns such as the North
Atlantic ridge or the negative phase of the NAO and mild
spells are more related to the positive phase regimes of the
NAO or the Scandinavian blocking. A change in the distribution of these patterns can affect the transport of heat, and
thus have an impact on the surface temperature. The effect of
this change in atmospheric circulation is comparable to the
effect of external forcings (greenhouse gases, volcanism and
solar activity) on the variability of temperatures. During the
exceptionally hot summer of 2003, these high temperatures
were shown to be partly due to the persistence of an anticyclone over Europe, which was in turn related to a precipitation anomaly over the Sahel, which dried up the
atmospheric column. It is therefore essential to consider
changes in the distribution of atmospheric circulation
regimes in order to interpret climate change.
This representation facilitates the interpretation of relationships between meteorology (fluctuations on very short
time scales, such as weather regimes) and climatology
(centennial climate fluctuations). This concept was applied
to a very different climate, such as that of the Last Glacial
Maximum 21,000 years before the present. Using numerical
simulations of the climate of this period, Kageyama et al.
(1999) found that the notion of weather regimes was not
30 An Introduction to the Holocene and Anthropic Disturbance
437