

Month
Month
Month
Month
Month
Month
Month
Month
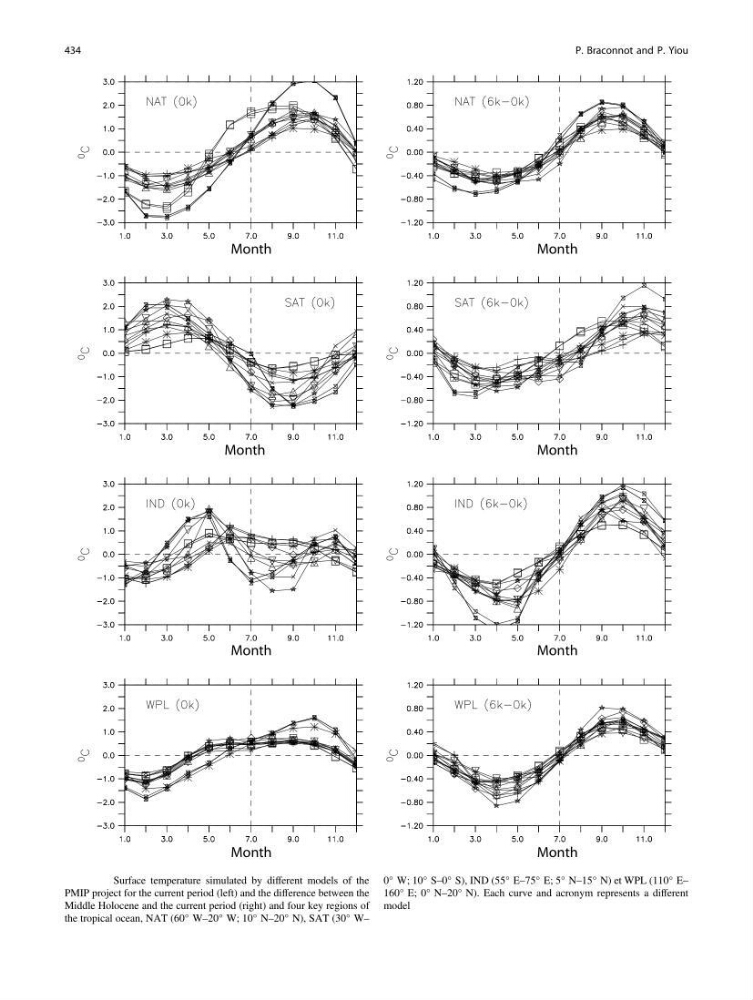
Fig. 30.8 Surface temperature simulated by different models of the
PMIP project for the current period (left) and the difference between the
Middle Holocene and the current period (right) and four key regions of
the tropical ocean, NAT (60° W–20° W; 10° N–20° N), SAT (30° W–
0° W; 10° S–0° S), IND (55° E–75° E; 5° N–15° N) et WPL (110° E–
160° E; 0° N–20° N). Each curve and acronym represents a different
model
434
P. Braconnot and P. Yiou
Month
Month
Month
Month
Month
Month
Month
Fig. 30.8 Surface temperature simulated by different models of the
PMIP project for the current period (left) and the difference between the
Middle Holocene and the current period (right) and four key regions of
the tropical ocean, NAT (60° W–20° W; 10° N–20° N), SAT (30° W–
0° W; 10° S–0° S), IND (55° E–75° E; 5° N–15° N) et WPL (110° E–
160° E; 0° N–20° N). Each curve and acronym represents a different
model
434
P. Braconnot and P. Yiou