

What Determines Sea Level?
It may seem easy to determine how sea level varied over time,
but it is in fact a difficult characteristic to estimate. Distinct
mechanisms intervene in these variations, involving important regional specificities. Since many observations are local,
the representativeness of each measurement must be estimated according to the place, the time and the nature of the
observation. Here, we identify the various processes that
cause sea level to vary and assess how they impact on the
interpretation of observations. Since we are interested in large
time scales, we focus only on the level averaged over several
years and so exclude the effect of tides and currents.
Sea level depends first of all on the mass of liquid water
available, a quantity that changes over time due to its storage
as ice on the continents during cold periods. This information is for the whole globe and it can be evaluated through
reconstructions of the average isotopic composition of the
ocean. Records of the isotopic composition of seawater are
indirect and are essentially of two types:
(1) The isotopic composition of deep water during the Last
Glacial Maximum (LGM) can be estimated by
inversion of the isotopic composition diffusion profile
of the interstitial water in the sedimentary column from
the water-sediment interface (Schrag et al. 1996). In this
way, in cores taken from the Pacific Ocean (the world’s
largest ocean basin), it was possible to establish that the
average enrichment of the ocean during the LGM was
1.0 ± 0.1‰ compared to today.
(2) The changes in the isotopic composition of deep water
can be reconstructed from isotopic analyses carried out
on the shells of benthic foraminifera after subtracting
the influence on these values of the variations in temperature of the deep waters as well as the local variations in the deep water isotopic composition
(Waelbroeck et al. EPILOG 2002).
Variations in the average isotopic composition of the
ocean can be translated into variations in the eustatic level of
the seas. Current knowledge indicates that the relationship
between these two quantities can be approximated initially
using a constant multiplicative factor, so that an enrichment
of 1‰ during the LGM corresponds to a decrease in the
eustatic sea level of about 130 m (Fig. 24.3). Sea level
changes have also been reconstructed from isotopic analyses
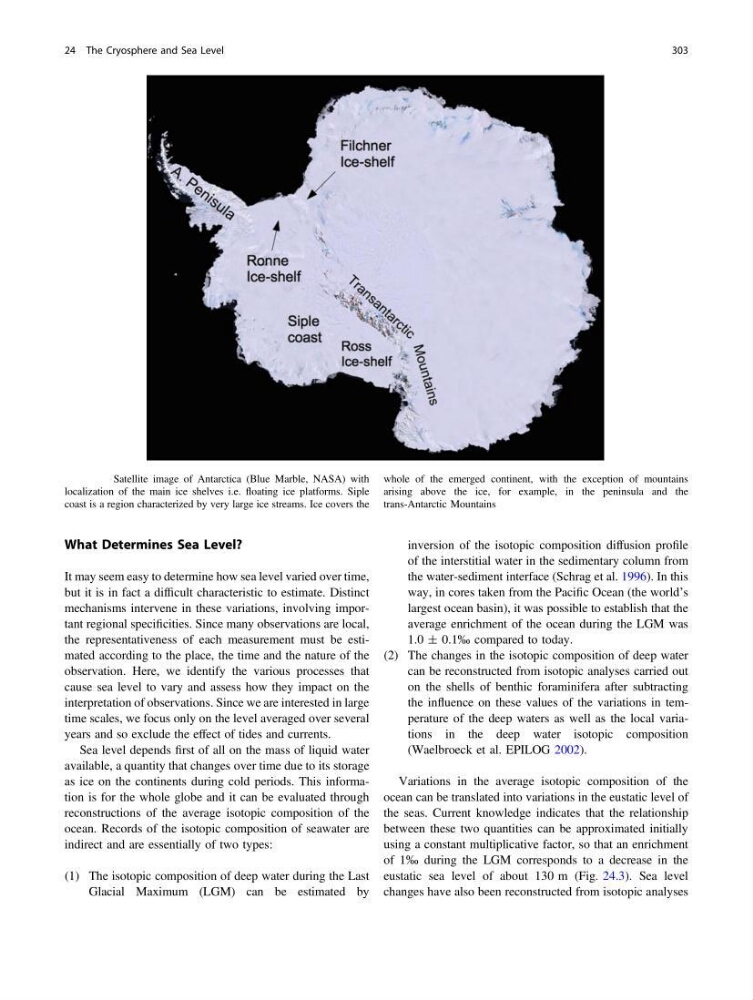
Fig. 24.2 Satellite image of Antarctica (Blue Marble, NASA) with
localization of the main ice shelves i.e. floating ice platforms. Siple
coast is a region characterized by very large ice streams. Ice covers the
whole of the emerged continent, with the exception of mountains
arising above the ice, for example, in the peninsula and the
trans-Antarctic Mountains
24 The Cryosphere and Sea Level
303
It may seem easy to determine how sea level varied over time,
but it is in fact a difficult characteristic to estimate. Distinct
mechanisms intervene in these variations, involving important regional specificities. Since many observations are local,
the representativeness of each measurement must be estimated according to the place, the time and the nature of the
observation. Here, we identify the various processes that
cause sea level to vary and assess how they impact on the
interpretation of observations. Since we are interested in large
time scales, we focus only on the level averaged over several
years and so exclude the effect of tides and currents.
Sea level depends first of all on the mass of liquid water
available, a quantity that changes over time due to its storage
as ice on the continents during cold periods. This information is for the whole globe and it can be evaluated through
reconstructions of the average isotopic composition of the
ocean. Records of the isotopic composition of seawater are
indirect and are essentially of two types:
(1) The isotopic composition of deep water during the Last
Glacial Maximum (LGM) can be estimated by
inversion of the isotopic composition diffusion profile
of the interstitial water in the sedimentary column from
the water-sediment interface (Schrag et al. 1996). In this
way, in cores taken from the Pacific Ocean (the world’s
largest ocean basin), it was possible to establish that the
average enrichment of the ocean during the LGM was
1.0 ± 0.1‰ compared to today.
(2) The changes in the isotopic composition of deep water
can be reconstructed from isotopic analyses carried out
on the shells of benthic foraminifera after subtracting
the influence on these values of the variations in temperature of the deep waters as well as the local variations in the deep water isotopic composition
(Waelbroeck et al. EPILOG 2002).
Variations in the average isotopic composition of the
ocean can be translated into variations in the eustatic level of
the seas. Current knowledge indicates that the relationship
between these two quantities can be approximated initially
using a constant multiplicative factor, so that an enrichment
of 1‰ during the LGM corresponds to a decrease in the
eustatic sea level of about 130 m (Fig. 24.3). Sea level
changes have also been reconstructed from isotopic analyses
Fig. 24.2 Satellite image of Antarctica (Blue Marble, NASA) with
localization of the main ice shelves i.e. floating ice platforms. Siple
coast is a region characterized by very large ice streams. Ice covers the
whole of the emerged continent, with the exception of mountains
arising above the ice, for example, in the peninsula and the
trans-Antarctic Mountains
24 The Cryosphere and Sea Level
303