

It is then feasible to estimate the change in mean ocean d w
related to variations in continental ice volume and sea level.
Locally, changes in the hydrological cycle (evaporation,
precipitation, water mass movements, melting events) can
cause additional variations in d w , of both climatic and
hydrological origin.
Reconstructing the evolution of the isotopic composition
of seawater in the past is in itself an interesting task because
d w tracks changes in the hydrologic cycle. However, we can
try to qualitatively interpret a record of paleo d w in terms of
paleosalinities (see Box 2).
Box 2. Practical Calculation of Paleosalinities
Estimating paleosalinity changes along a sediment
core requires the following steps:
– Measure d c and T at each level so as to derive a
recording of paleo d w over the time period covered
by the core, using the paleotemperature equation
(Eq. 21.1).
– Estimate global d w changes d
ice
w
À Á
related to continental ice volume variations over the study period
using known records of changes in sea level.
A drop of 120 m in sea level is accompanied by an
increase in d
ice
w of +1.0‰. Given an average depth
of the modern ocean of *3900 m and an average
salinity of 34.7 psu, and since the amount of salt in
the ocean remains constant, a drop in sea level of
120 m is also accompanied by an increase in
salinity. The average ocean salinity becomes:
34:7 Â 3900
ð
Þ =3780 ¼ 35:8 psu:
Salinity has thus increased by about 1.1 psu and
d
ice
w by +1.0‰. Coupled models of the Northern
Hemisphere ice sheets allow the ice-sheet contribution to the variability in oxygen isotope composition and sea level changes to be determined
(Bintanja et al. 2005).
– Estimate the variation in local isotopic composition
d
local
w
due to hydrological changes by subtracting
d
ice
w changes from the d w value reconstructed for
each core level. The corresponding change in
salinity can be estimated from current observations
(Fig. 21.7).
The statistical error associated with this approach is
high and rarely permits meaningful quantitative
salinity reconstructions because of the associated large
uncertainties (Rohling and Bigg 1998; Schmidt 1999;
Rohling 2000; Legrande and Schmidt 2011; Caley and
Roche 2015). The structural/analytical error is in the
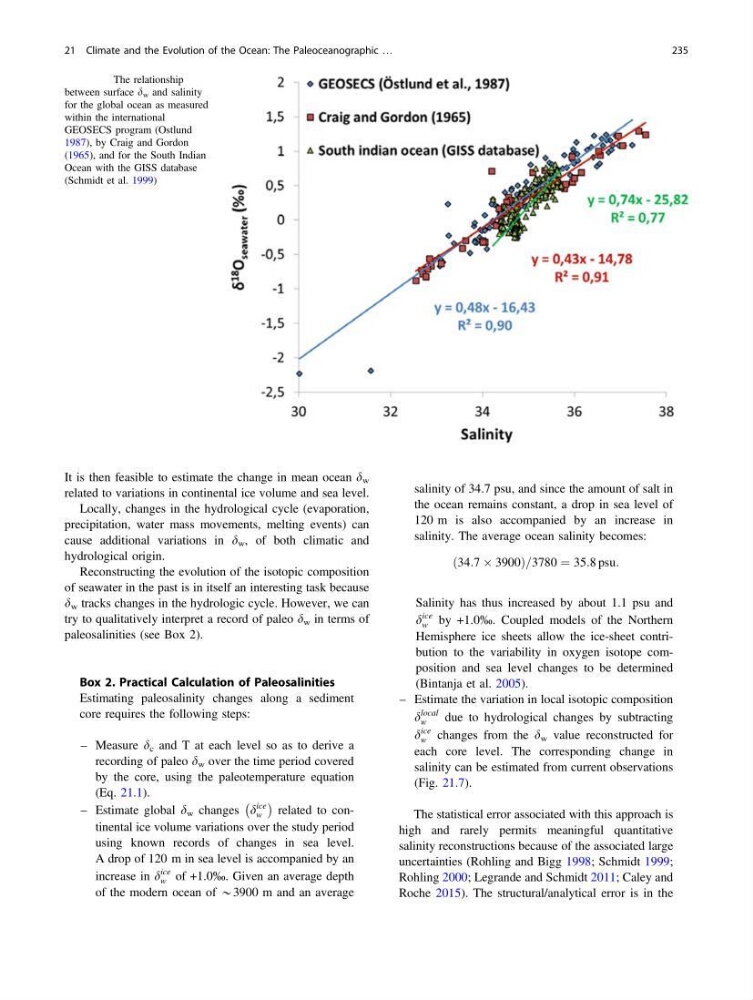
Fig. 21.8 The relationship
between surface d w and salinity
for the global ocean as measured
within the international
GEOSECS program (Ostlund
1987), by Craig and Gordon
(1965), and for the South Indian
Ocean with the GISS database
(Schmidt et al. 1999)
21 Climate and the Evolution of the Ocean: The Paleoceanographic …
235
related to variations in continental ice volume and sea level.
Locally, changes in the hydrological cycle (evaporation,
precipitation, water mass movements, melting events) can
cause additional variations in d w , of both climatic and
hydrological origin.
Reconstructing the evolution of the isotopic composition
of seawater in the past is in itself an interesting task because
d w tracks changes in the hydrologic cycle. However, we can
try to qualitatively interpret a record of paleo d w in terms of
paleosalinities (see Box 2).
Box 2. Practical Calculation of Paleosalinities
Estimating paleosalinity changes along a sediment
core requires the following steps:
– Measure d c and T at each level so as to derive a
recording of paleo d w over the time period covered
by the core, using the paleotemperature equation
(Eq. 21.1).
– Estimate global d w changes d
ice
w
À Á
related to continental ice volume variations over the study period
using known records of changes in sea level.
A drop of 120 m in sea level is accompanied by an
increase in d
ice
w of +1.0‰. Given an average depth
of the modern ocean of *3900 m and an average
salinity of 34.7 psu, and since the amount of salt in
the ocean remains constant, a drop in sea level of
120 m is also accompanied by an increase in
salinity. The average ocean salinity becomes:
34:7 Â 3900
ð
Þ =3780 ¼ 35:8 psu:
Salinity has thus increased by about 1.1 psu and
d
ice
w by +1.0‰. Coupled models of the Northern
Hemisphere ice sheets allow the ice-sheet contribution to the variability in oxygen isotope composition and sea level changes to be determined
(Bintanja et al. 2005).
– Estimate the variation in local isotopic composition
d
local
w
due to hydrological changes by subtracting
d
ice
w changes from the d w value reconstructed for
each core level. The corresponding change in
salinity can be estimated from current observations
(Fig. 21.7).
The statistical error associated with this approach is
high and rarely permits meaningful quantitative
salinity reconstructions because of the associated large
uncertainties (Rohling and Bigg 1998; Schmidt 1999;
Rohling 2000; Legrande and Schmidt 2011; Caley and
Roche 2015). The structural/analytical error is in the
Fig. 21.8 The relationship
between surface d w and salinity
for the global ocean as measured
within the international
GEOSECS program (Ostlund
1987), by Craig and Gordon
(1965), and for the South Indian
Ocean with the GISS database
(Schmidt et al. 1999)
21 Climate and the Evolution of the Ocean: The Paleoceanographic …
235