

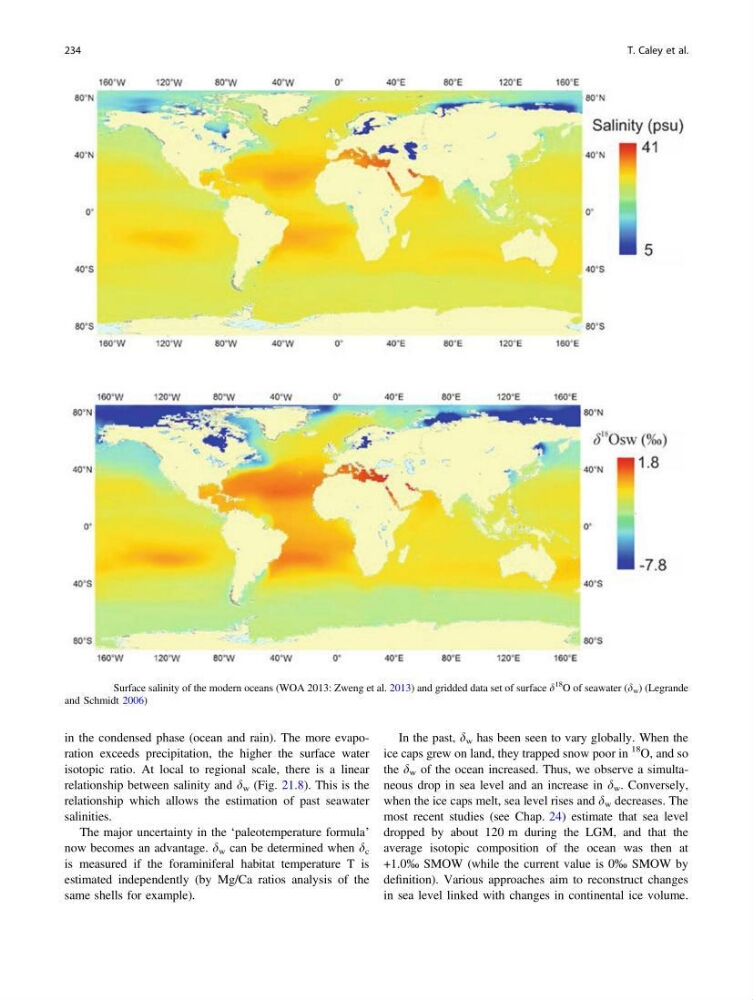
in the condensed phase (ocean and rain). The more evaporation exceeds precipitation, the higher the surface water
isotopic ratio. At local to regional scale, there is a linear
relationship between salinity and d w (Fig. 21.8). This is the
relationship which allows the estimation of past seawater
salinities.
The major uncertainty in the ‘paleotemperature formula’
now becomes an advantage. d w can be determined when d c
is measured if the foraminiferal habitat temperature T is
estimated independently (by Mg/Ca ratios analysis of the
same shells for example).
In the past, d w has been seen to vary globally. When the
ice caps grew on land, they trapped snow poor in
18 O, and so
the d w of the ocean increased. Thus, we observe a simultaneous drop in sea level and an increase in d w . Conversely,
when the ice caps melt, sea level rises and d w decreases. The
most recent studies (see Chap. 24) estimate that sea level
dropped by about 120 m during the LGM, and that the
average isotopic composition of the ocean was then at
+1.0‰ SMOW (while the current value is 0‰ SMOW by
definition). Various approaches aim to reconstruct changes
in sea level linked with changes in continental ice volume.
Fig. 21.7 Surface salinity of the modern oceans (WOA 2013: Zweng et al. 2013) and gridded data set of surface d
18
O of seawater (d w ) (Legrande
and Schmidt 2006)
234
T. Caley et al.
isotopic ratio. At local to regional scale, there is a linear
relationship between salinity and d w (Fig. 21.8). This is the
relationship which allows the estimation of past seawater
salinities.
The major uncertainty in the ‘paleotemperature formula’
now becomes an advantage. d w can be determined when d c
is measured if the foraminiferal habitat temperature T is
estimated independently (by Mg/Ca ratios analysis of the
same shells for example).
In the past, d w has been seen to vary globally. When the
ice caps grew on land, they trapped snow poor in
18 O, and so
the d w of the ocean increased. Thus, we observe a simultaneous drop in sea level and an increase in d w . Conversely,
when the ice caps melt, sea level rises and d w decreases. The
most recent studies (see Chap. 24) estimate that sea level
dropped by about 120 m during the LGM, and that the
average isotopic composition of the ocean was then at
+1.0‰ SMOW (while the current value is 0‰ SMOW by
definition). Various approaches aim to reconstruct changes
in sea level linked with changes in continental ice volume.
Fig. 21.7 Surface salinity of the modern oceans (WOA 2013: Zweng et al. 2013) and gridded data set of surface d
18
O of seawater (d w ) (Legrande
and Schmidt 2006)
234
T. Caley et al.