

American monsoon pattern. This cell is strongly disrupted
by anomalies in the temperature of surface waters in the
tropical Pacific.
We therefore think that ENSO events are likely to mark
the isotopic composition of Andean ice (Bradley et al. 2003;
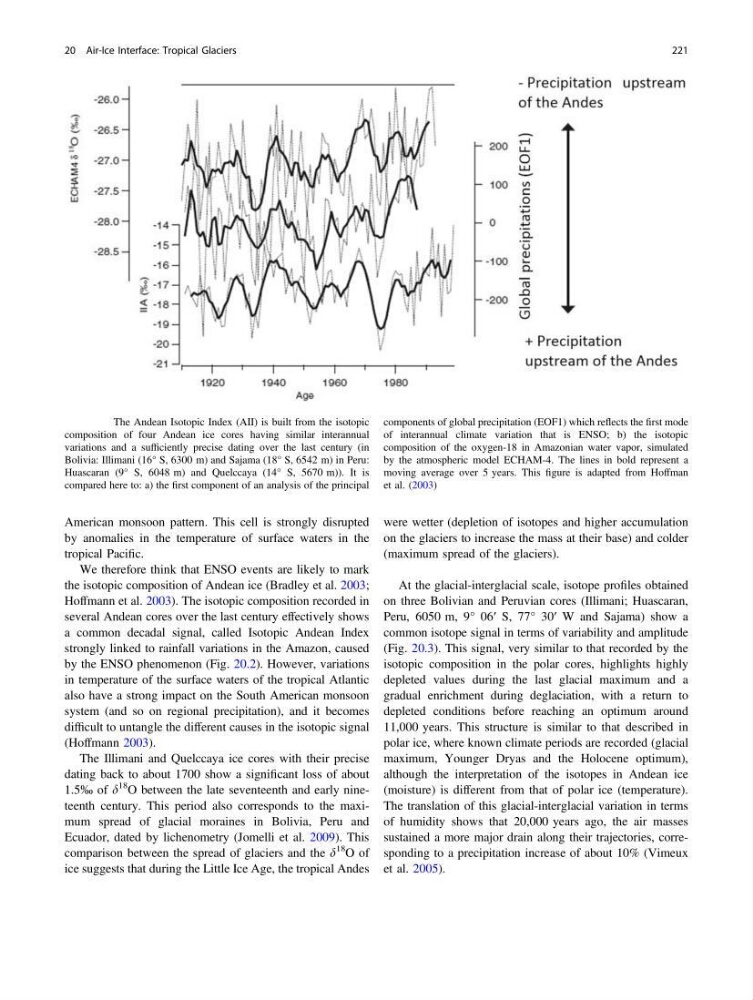
Hoffmann et al. 2003). The isotopic composition recorded in
several Andean cores over the last century effectively shows
a common decadal signal, called Isotopic Andean Index
strongly linked to rainfall variations in the Amazon, caused
by the ENSO phenomenon (Fig. 20.2). However, variations
in temperature of the surface waters of the tropical Atlantic
also have a strong impact on the South American monsoon
system (and so on regional precipitation), and it becomes
difficult to untangle the different causes in the isotopic signal
(Hoffmann 2003).
The Illimani and Quelccaya ice cores with their precise
dating back to about 1700 show a significant loss of about
1.5‰ of d
18 O between the late seventeenth and early nineteenth century. This period also corresponds to the maximum spread of glacial moraines in Bolivia, Peru and
Ecuador, dated by lichenometry (Jomelli et al. 2009). This
comparison between the spread of glaciers and the d
18 O of
ice suggests that during the Little Ice Age, the tropical Andes
were wetter (depletion of isotopes and higher accumulation
on the glaciers to increase the mass at their base) and colder
(maximum spread of the glaciers).
At the glacial-interglacial scale, isotope profiles obtained
on three Bolivian and Peruvian cores (Illimani; Huascaran,
Peru, 6050 m, 9° 06′ S, 77° 30′ W and Sajama) show a
common isotope signal in terms of variability and amplitude
(Fig. 20.3). This signal, very similar to that recorded by the
isotopic composition in the polar cores, highlights highly
depleted values during the last glacial maximum and a
gradual enrichment during deglaciation, with a return to
depleted conditions before reaching an optimum around
11,000 years. This structure is similar to that described in
polar ice, where known climate periods are recorded (glacial
maximum, Younger Dryas and the Holocene optimum),
although the interpretation of the isotopes in Andean ice
(moisture) is different from that of polar ice (temperature).
The translation of this glacial-interglacial variation in terms
of humidity shows that 20,000 years ago, the air masses
sustained a more major drain along their trajectories, corresponding to a precipitation increase of about 10% (Vimeux
et al. 2005).
Fig. 20.2 The Andean Isotopic Index (AII) is built from the isotopic
composition of four Andean ice cores having similar interannual
variations and a sufficiently precise dating over the last century (in
Bolivia: Illimani (16° S, 6300 m) and Sajama (18° S, 6542 m) in Peru:
Huascaran (9° S, 6048 m) and Quelccaya (14° S, 5670 m)). It is
compared here to: a) the first component of an analysis of the principal
components of global precipitation (EOF1) which reflects the first mode
of interannual climate variation that is ENSO; b) the isotopic
composition of the oxygen-18 in Amazonian water vapor, simulated
by the atmospheric model ECHAM-4. The lines in bold represent a
moving average over 5 years. This figure is adapted from Hoffman
et al. (2003)
20 Air-Ice Interface: Tropical Glaciers
221
by anomalies in the temperature of surface waters in the
tropical Pacific.
We therefore think that ENSO events are likely to mark
the isotopic composition of Andean ice (Bradley et al. 2003;
Hoffmann et al. 2003). The isotopic composition recorded in
several Andean cores over the last century effectively shows
a common decadal signal, called Isotopic Andean Index
strongly linked to rainfall variations in the Amazon, caused
by the ENSO phenomenon (Fig. 20.2). However, variations
in temperature of the surface waters of the tropical Atlantic
also have a strong impact on the South American monsoon
system (and so on regional precipitation), and it becomes
difficult to untangle the different causes in the isotopic signal
(Hoffmann 2003).
The Illimani and Quelccaya ice cores with their precise
dating back to about 1700 show a significant loss of about
1.5‰ of d
18 O between the late seventeenth and early nineteenth century. This period also corresponds to the maximum spread of glacial moraines in Bolivia, Peru and
Ecuador, dated by lichenometry (Jomelli et al. 2009). This
comparison between the spread of glaciers and the d
18 O of
ice suggests that during the Little Ice Age, the tropical Andes
were wetter (depletion of isotopes and higher accumulation
on the glaciers to increase the mass at their base) and colder
(maximum spread of the glaciers).
At the glacial-interglacial scale, isotope profiles obtained
on three Bolivian and Peruvian cores (Illimani; Huascaran,
Peru, 6050 m, 9° 06′ S, 77° 30′ W and Sajama) show a
common isotope signal in terms of variability and amplitude
(Fig. 20.3). This signal, very similar to that recorded by the
isotopic composition in the polar cores, highlights highly
depleted values during the last glacial maximum and a
gradual enrichment during deglaciation, with a return to
depleted conditions before reaching an optimum around
11,000 years. This structure is similar to that described in
polar ice, where known climate periods are recorded (glacial
maximum, Younger Dryas and the Holocene optimum),
although the interpretation of the isotopes in Andean ice
(moisture) is different from that of polar ice (temperature).
The translation of this glacial-interglacial variation in terms
of humidity shows that 20,000 years ago, the air masses
sustained a more major drain along their trajectories, corresponding to a precipitation increase of about 10% (Vimeux
et al. 2005).
Fig. 20.2 The Andean Isotopic Index (AII) is built from the isotopic
composition of four Andean ice cores having similar interannual
variations and a sufficiently precise dating over the last century (in
Bolivia: Illimani (16° S, 6300 m) and Sajama (18° S, 6542 m) in Peru:
Huascaran (9° S, 6048 m) and Quelccaya (14° S, 5670 m)). It is
compared here to: a) the first component of an analysis of the principal
components of global precipitation (EOF1) which reflects the first mode
of interannual climate variation that is ENSO; b) the isotopic
composition of the oxygen-18 in Amazonian water vapor, simulated
by the atmospheric model ECHAM-4. The lines in bold represent a
moving average over 5 years. This figure is adapted from Hoffman
et al. (2003)
20 Air-Ice Interface: Tropical Glaciers
221