

to reconstruct variations in spring-summer temperatures in
Burgundy since the fourteenth century from the series of
dates shown in Fig. 17.1. This reconstruction highlights
that the cooling of the climate in the period 1690–1800,
the start of a long cool period that continued until 1970,
was by a little more than one degree. The exceptionally
hot summer of 2003 also shows up very clearly (Chuine
et al. 2004).
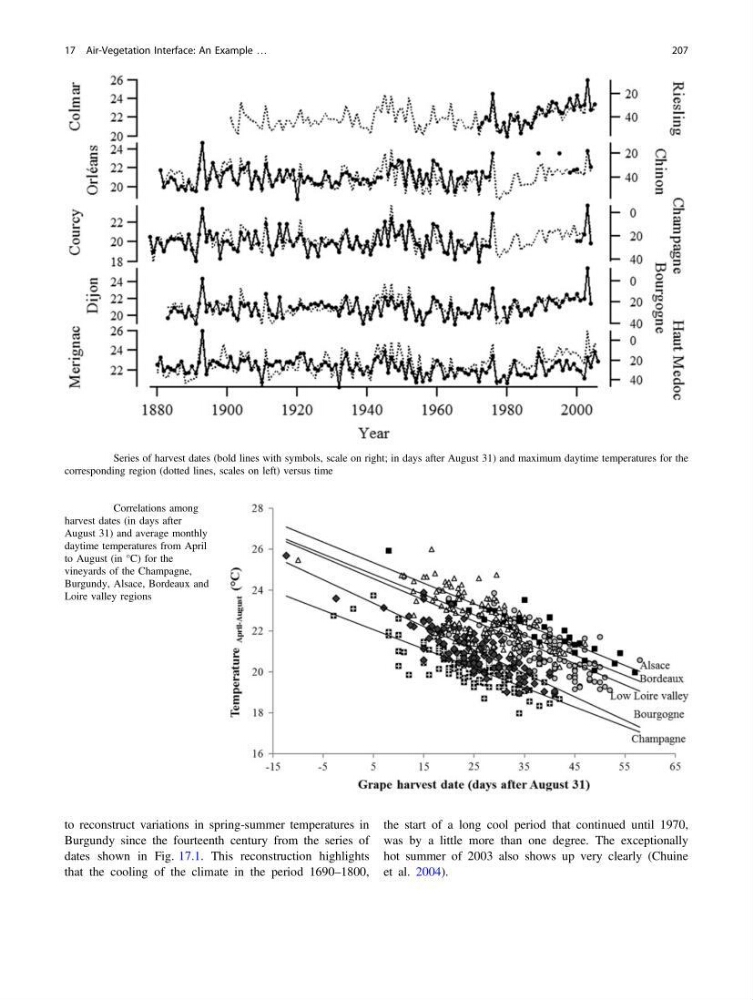
Fig. 17.2 Series of harvest dates (bold lines with symbols, scale on right; in days after August 31) and maximum daytime temperatures for the
corresponding region (dotted lines, scales on left) versus time
Fig. 17.3 Correlations among
harvest dates (in days after
August 31) and average monthly
daytime temperatures from April
to August (in °C) for the
vineyards of the Champagne,
Burgundy, Alsace, Bordeaux and
Loire valley regions
17 Air-Vegetation Interface: An Example …
207
Burgundy since the fourteenth century from the series of
dates shown in Fig. 17.1. This reconstruction highlights
that the cooling of the climate in the period 1690–1800,
the start of a long cool period that continued until 1970,
was by a little more than one degree. The exceptionally
hot summer of 2003 also shows up very clearly (Chuine
et al. 2004).
Fig. 17.2 Series of harvest dates (bold lines with symbols, scale on right; in days after August 31) and maximum daytime temperatures for the
corresponding region (dotted lines, scales on left) versus time
Fig. 17.3 Correlations among
harvest dates (in days after
August 31) and average monthly
daytime temperatures from April
to August (in °C) for the
vineyards of the Champagne,
Burgundy, Alsace, Bordeaux and
Loire valley regions
17 Air-Vegetation Interface: An Example …
207