

The harvest date series and temperatures present many
similarities, at the annual, decadal and multi-decadal scale
(see example in Fig. 17.2). The best correlations (statistically significant with a maximum R) between harvest dates
and climate data are those with the average maximal temperatures from April to August. For these correlations, the
slopes are around −6 to −10 days/°C for all the vineyards
(Fig. 17.3). In other words, regardless of the earliness or
lateness of the vines and regardless of the geographic location (including soil, orientation and meteorology), a variation of six to ten days on the date of the harvest reflects a
difference of about 1 °C from the average maximum
temperatures for the growing season (April in August; see
also for example Cook and Wolkovich 2016).
The phenology of woody species can be simulated by
models that express the relationship between the maturation process and daytime temperatures. A model is adapted to describe the phenology of a species, or a variety in
the case of the vine. Chuine et al. (2004) have thus used
recent observations of phenological development of the
pinot noir variety, made between 1964 and 2001 in Colmar (France), by INRA, to model the phenology of this
variety and to calculate the veraison and harvest dates
from temperatures. The inverted model has been used here
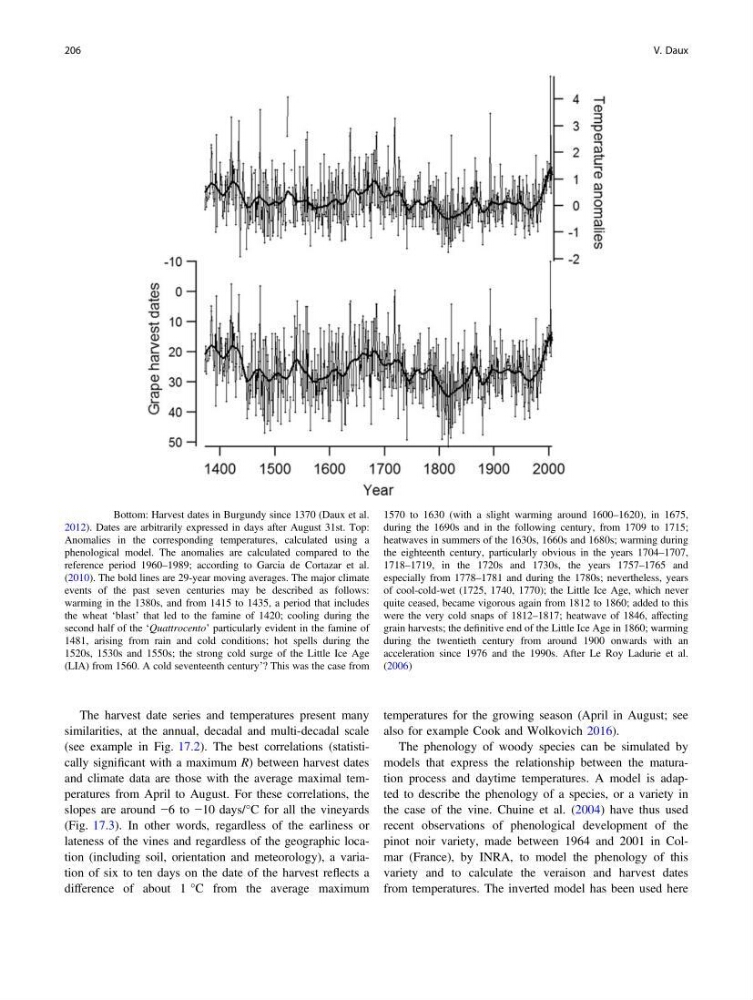
Fig. 17.1 Bottom: Harvest dates in Burgundy since 1370 (Daux et al.
2012). Dates are arbitrarily expressed in days after August 31st. Top:
Anomalies in the corresponding temperatures, calculated using a
phenological model. The anomalies are calculated compared to the
reference period 1960–1989; according to Garcia de Cortazar et al.
(2010). The bold lines are 29-year moving averages. The major climate
events of the past seven centuries may be described as follows:
warming in the 1380s, and from 1415 to 1435, a period that includes
the wheat ‘blast’ that led to the famine of 1420; cooling during the
second half of the ‘Quattrocento’ particularly evident in the famine of
1481, arising from rain and cold conditions; hot spells during the
1520s, 1530s and 1550s; the strong cold surge of the Little Ice Age
(LIA) from 1560. A cold seventeenth century’? This was the case from
1570 to 1630 (with a slight warming around 1600–1620), in 1675,
during the 1690s and in the following century, from 1709 to 1715;
heatwaves in summers of the 1630s, 1660s and 1680s; warming during
the eighteenth century, particularly obvious in the years 1704–1707,
1718–1719, in the 1720s and 1730s, the years 1757–1765 and
especially from 1778–1781 and during the 1780s; nevertheless, years
of cool-cold-wet (1725, 1740, 1770); the Little Ice Age, which never
quite ceased, became vigorous again from 1812 to 1860; added to this
were the very cold snaps of 1812–1817; heatwave of 1846, affecting
grain harvests; the definitive end of the Little Ice Age in 1860; warming
during the twentieth century from around 1900 onwards with an
acceleration since 1976 and the 1990s. After Le Roy Ladurie et al.
(2006)
206
V. Daux
similarities, at the annual, decadal and multi-decadal scale
(see example in Fig. 17.2). The best correlations (statistically significant with a maximum R) between harvest dates
and climate data are those with the average maximal temperatures from April to August. For these correlations, the
slopes are around −6 to −10 days/°C for all the vineyards
(Fig. 17.3). In other words, regardless of the earliness or
lateness of the vines and regardless of the geographic location (including soil, orientation and meteorology), a variation of six to ten days on the date of the harvest reflects a
difference of about 1 °C from the average maximum
temperatures for the growing season (April in August; see
also for example Cook and Wolkovich 2016).
The phenology of woody species can be simulated by
models that express the relationship between the maturation process and daytime temperatures. A model is adapted to describe the phenology of a species, or a variety in
the case of the vine. Chuine et al. (2004) have thus used
recent observations of phenological development of the
pinot noir variety, made between 1964 and 2001 in Colmar (France), by INRA, to model the phenology of this
variety and to calculate the veraison and harvest dates
from temperatures. The inverted model has been used here
Fig. 17.1 Bottom: Harvest dates in Burgundy since 1370 (Daux et al.
2012). Dates are arbitrarily expressed in days after August 31st. Top:
Anomalies in the corresponding temperatures, calculated using a
phenological model. The anomalies are calculated compared to the
reference period 1960–1989; according to Garcia de Cortazar et al.
(2010). The bold lines are 29-year moving averages. The major climate
events of the past seven centuries may be described as follows:
warming in the 1380s, and from 1415 to 1435, a period that includes
the wheat ‘blast’ that led to the famine of 1420; cooling during the
second half of the ‘Quattrocento’ particularly evident in the famine of
1481, arising from rain and cold conditions; hot spells during the
1520s, 1530s and 1550s; the strong cold surge of the Little Ice Age
(LIA) from 1560. A cold seventeenth century’? This was the case from
1570 to 1630 (with a slight warming around 1600–1620), in 1675,
during the 1690s and in the following century, from 1709 to 1715;
heatwaves in summers of the 1630s, 1660s and 1680s; warming during
the eighteenth century, particularly obvious in the years 1704–1707,
1718–1719, in the 1720s and 1730s, the years 1757–1765 and
especially from 1778–1781 and during the 1780s; nevertheless, years
of cool-cold-wet (1725, 1740, 1770); the Little Ice Age, which never
quite ceased, became vigorous again from 1812 to 1860; added to this
were the very cold snaps of 1812–1817; heatwave of 1846, affecting
grain harvests; the definitive end of the Little Ice Age in 1860; warming
during the twentieth century from around 1900 onwards with an
acceleration since 1976 and the 1990s. After Le Roy Ladurie et al.
(2006)
206
V. Daux