

summer solstice. However, for this second indicator, it is
important to correct for variations in the altitude at which the
bubbles formed, as this will have an impact on atmospheric
pressure and thus the air content of these bubbles.
Although the specific physical link between these indicators and insolation is still subject to debate and research,
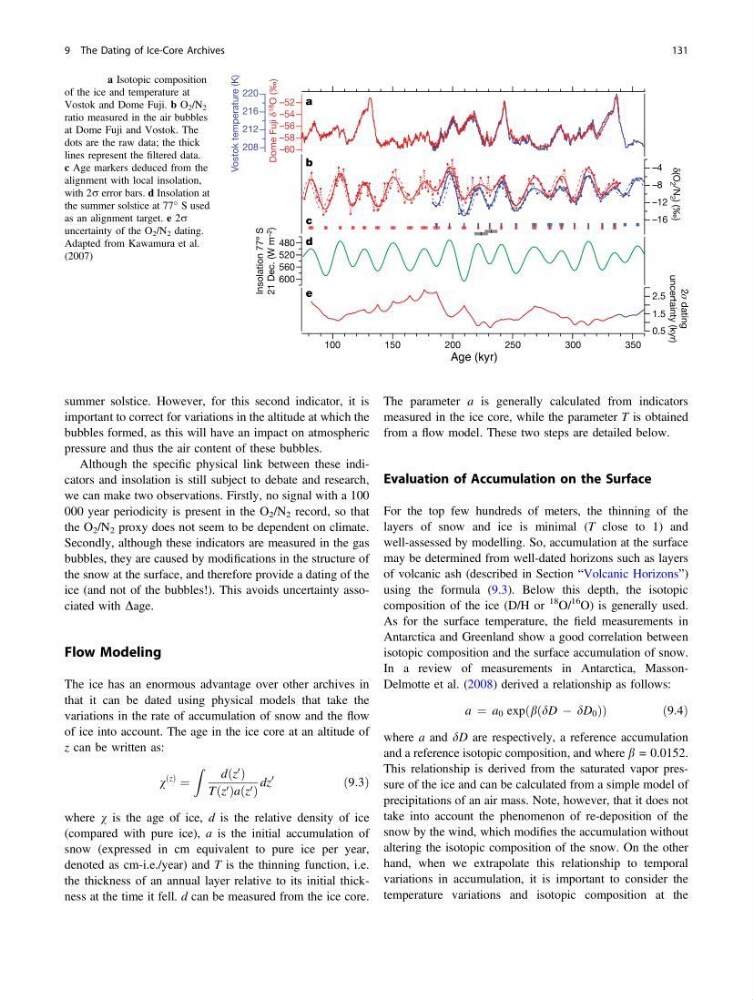
we can make two observations. Firstly, no signal with a 100
000 year periodicity is present in the O 2 /N 2 record, so that
the O 2 /N 2 proxy does not seem to be dependent on climate.
Secondly, although these indicators are measured in the gas
bubbles, they are caused by modifications in the structure of
the snow at the surface, and therefore provide a dating of the
ice (and not of the bubbles!). This avoids uncertainty associated with Dage.
Flow Modeling
The ice has an enormous advantage over other archives in
that it can be dated using physical models that take the
variations in the rate of accumulation of snow and the flow
of ice into account. The age in the ice core at an altitude of
z can be written as:
v
z
ð Þ
¼
Z
d z
0
ð Þ
T z 0
ð Þa z 0
ð Þ
dz
0
ð9:3Þ
where v is the age of ice, d is the relative density of ice
(compared with pure ice), a is the initial accumulation of
snow (expressed in cm equivalent to pure ice per year,
denoted as cm-i.e./year) and T is the thinning function, i.e.
the thickness of an annual layer relative to its initial thickness at the time it fell. d can be measured from the ice core.
The parameter a is generally calculated from indicators
measured in the ice core, while the parameter T is obtained
from a flow model. These two steps are detailed below.
Evaluation of Accumulation on the Surface
For the top few hundreds of meters, the thinning of the
layers of snow and ice is minimal (T close to 1) and
well-assessed by modelling. So, accumulation at the surface
may be determined from well-dated horizons such as layers
of volcanic ash (described in Section “Volcanic Horizons”)
using the formula (9.3). Below this depth, the isotopic
composition of the ice (D/H or
18 O/
16 O) is generally used.
As for the surface temperature, the field measurements in
Antarctica and Greenland show a good correlation between
isotopic composition and the surface accumulation of snow.
In a review of measurements in Antarctica, MassonDelmotte et al. (2008) derived a relationship as follows:
a ¼ a 0 expðbðdD À dD 0 ÞÞ
ð9:4Þ
where a and dD are respectively, a reference accumulation
and a reference isotopic composition, and where b = 0.0152.
This relationship is derived from the saturated vapor pressure of the ice and can be calculated from a simple model of
precipitations of an air mass. Note, however, that it does not
take into account the phenomenon of re-deposition of the
snow by the wind, which modifies the accumulation without
altering the isotopic composition of the snow. On the other
hand, when we extrapolate this relationship to temporal
variations in accumulation, it is important to consider the
temperature variations and isotopic composition at the
Age (kyr)
Fig. 9.9 a Isotopic composition
of the ice and temperature at
Vostok and Dome Fuji. b O 2 /N 2
ratio measured in the air bubbles
at Dome Fuji and Vostok. The
dots are the raw data; the thick
lines represent the filtered data.
c Age markers deduced from the
alignment with local insolation,
with 2r error bars. d Insolation at
the summer solstice at 77° S used
as an alignment target. e 2r
uncertainty of the O 2 /N 2 dating.
Adapted from Kawamura et al.
(2007)
9 The Dating of Ice-Core Archives
131
important to correct for variations in the altitude at which the
bubbles formed, as this will have an impact on atmospheric
pressure and thus the air content of these bubbles.
Although the specific physical link between these indicators and insolation is still subject to debate and research,
we can make two observations. Firstly, no signal with a 100
000 year periodicity is present in the O 2 /N 2 record, so that
the O 2 /N 2 proxy does not seem to be dependent on climate.
Secondly, although these indicators are measured in the gas
bubbles, they are caused by modifications in the structure of
the snow at the surface, and therefore provide a dating of the
ice (and not of the bubbles!). This avoids uncertainty associated with Dage.
Flow Modeling
The ice has an enormous advantage over other archives in
that it can be dated using physical models that take the
variations in the rate of accumulation of snow and the flow
of ice into account. The age in the ice core at an altitude of
z can be written as:
v
z
ð Þ
¼
Z
d z
0
ð Þ
T z 0
ð Þa z 0
ð Þ
dz
0
ð9:3Þ
where v is the age of ice, d is the relative density of ice
(compared with pure ice), a is the initial accumulation of
snow (expressed in cm equivalent to pure ice per year,
denoted as cm-i.e./year) and T is the thinning function, i.e.
the thickness of an annual layer relative to its initial thickness at the time it fell. d can be measured from the ice core.
The parameter a is generally calculated from indicators
measured in the ice core, while the parameter T is obtained
from a flow model. These two steps are detailed below.
Evaluation of Accumulation on the Surface
For the top few hundreds of meters, the thinning of the
layers of snow and ice is minimal (T close to 1) and
well-assessed by modelling. So, accumulation at the surface
may be determined from well-dated horizons such as layers
of volcanic ash (described in Section “Volcanic Horizons”)
using the formula (9.3). Below this depth, the isotopic
composition of the ice (D/H or
18 O/
16 O) is generally used.
As for the surface temperature, the field measurements in
Antarctica and Greenland show a good correlation between
isotopic composition and the surface accumulation of snow.
In a review of measurements in Antarctica, MassonDelmotte et al. (2008) derived a relationship as follows:
a ¼ a 0 expðbðdD À dD 0 ÞÞ
ð9:4Þ
where a and dD are respectively, a reference accumulation
and a reference isotopic composition, and where b = 0.0152.
This relationship is derived from the saturated vapor pressure of the ice and can be calculated from a simple model of
precipitations of an air mass. Note, however, that it does not
take into account the phenomenon of re-deposition of the
snow by the wind, which modifies the accumulation without
altering the isotopic composition of the snow. On the other
hand, when we extrapolate this relationship to temporal
variations in accumulation, it is important to consider the
temperature variations and isotopic composition at the
Age (kyr)
Fig. 9.9 a Isotopic composition
of the ice and temperature at
Vostok and Dome Fuji. b O 2 /N 2
ratio measured in the air bubbles
at Dome Fuji and Vostok. The
dots are the raw data; the thick
lines represent the filtered data.
c Age markers deduced from the
alignment with local insolation,
with 2r error bars. d Insolation at
the summer solstice at 77° S used
as an alignment target. e 2r
uncertainty of the O 2 /N 2 dating.
Adapted from Kawamura et al.
(2007)
9 The Dating of Ice-Core Archives
131