

source of the air masses which also alter the isotopic composition of the ice (Parrenin et al. 2007b).
Ice Flow Models
Ice has a solid exhibiting viscoplastic behavior where the
relationship between stress and strain can be determined
experimentally and theoretically. It is thus possible to simulate the trajectory followed by a particle of ice within the
glacier over time in order to establish a chronology.
Modeling of behavior of ice within an ice sheet requires not
only a good knowledge of the viscoplastic properties of the
material, but of the conditions at the boundaries of the
cap. These boundary conditions are: (1) the temperature and
surface accumulation over time; (2) basal conditions, such as
the geothermal flow and the rate of friction on the bedrock;
(3) the lateral conditions for the area under consideration,
since local models are used for dating purposes. These lateral conditions generally result from global simulations of
the polar cap over time (Ritz et al. 2001). In this way, the
thinning function adapted to the ice core drilling site is
obtained.
Below is a qualitative description of how this function
varies. For a stationary dome, the thinning function can be
written:
T ¼
1 À
m
a
x þ
m
a
ð9:5Þ
with l = m/a the ratio of basal fusion to surface accumulation and with x the standard vertical profile of horizontal
flow (see Parrenin et al. 2007b, for details). x varies almost
linearly from 0 at the ice base interface to 1 at the surface,
because the deformation is concentrated at the base of glacier. For certain domes, the Raymond effect causes more
deformation at the top of the ice and therefore a less linear x
profile.
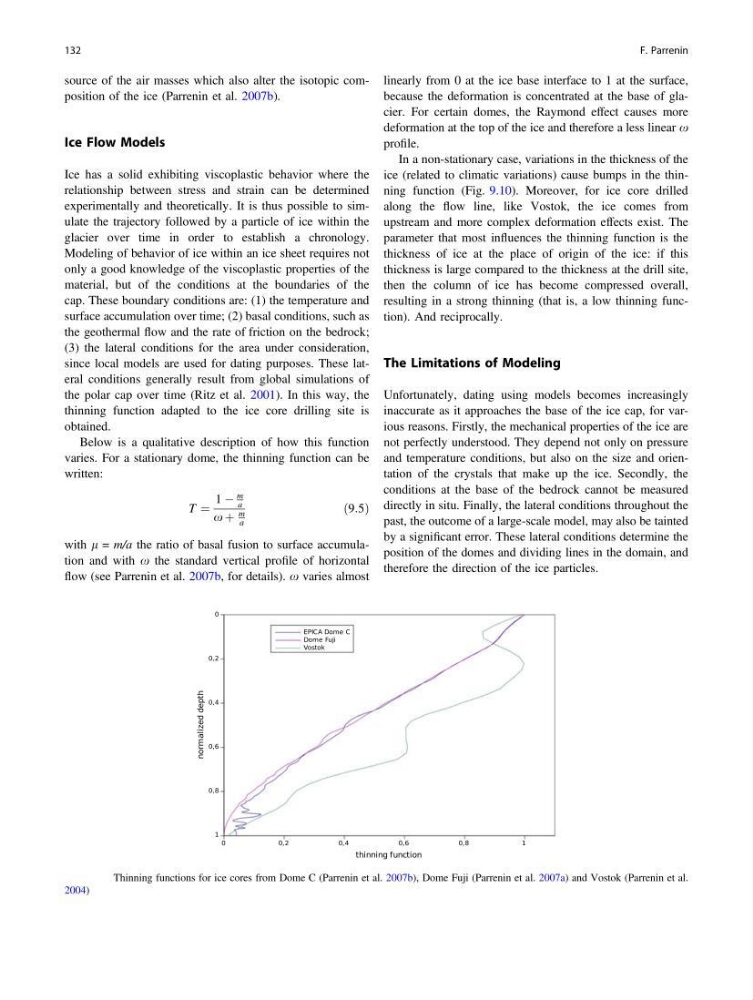
In a non-stationary case, variations in the thickness of the
ice (related to climatic variations) cause bumps in the thinning function (Fig. 9.10). Moreover, for ice core drilled
along the flow line, like Vostok, the ice comes from
upstream and more complex deformation effects exist. The
parameter that most influences the thinning function is the
thickness of ice at the place of origin of the ice: if this
thickness is large compared to the thickness at the drill site,
then the column of ice has become compressed overall,
resulting in a strong thinning (that is, a low thinning function). And reciprocally.
The Limitations of Modeling
Unfortunately, dating using models becomes increasingly
inaccurate as it approaches the base of the ice cap, for various reasons. Firstly, the mechanical properties of the ice are
not perfectly understood. They depend not only on pressure
and temperature conditions, but also on the size and orientation of the crystals that make up the ice. Secondly, the
conditions at the base of the bedrock cannot be measured
directly in situ. Finally, the lateral conditions throughout the
past, the outcome of a large-scale model, may also be tainted
by a significant error. These lateral conditions determine the
position of the domes and dividing lines in the domain, and
therefore the direction of the ice particles.
Fig. 9.10 Thinning functions for ice cores from Dome C (Parrenin et al. 2007b), Dome Fuji (Parrenin et al. 2007a) and Vostok (Parrenin et al.
2004)
132
F. Parrenin
Ice Flow Models
Ice has a solid exhibiting viscoplastic behavior where the
relationship between stress and strain can be determined
experimentally and theoretically. It is thus possible to simulate the trajectory followed by a particle of ice within the
glacier over time in order to establish a chronology.
Modeling of behavior of ice within an ice sheet requires not
only a good knowledge of the viscoplastic properties of the
material, but of the conditions at the boundaries of the
cap. These boundary conditions are: (1) the temperature and
surface accumulation over time; (2) basal conditions, such as
the geothermal flow and the rate of friction on the bedrock;
(3) the lateral conditions for the area under consideration,
since local models are used for dating purposes. These lateral conditions generally result from global simulations of
the polar cap over time (Ritz et al. 2001). In this way, the
thinning function adapted to the ice core drilling site is
obtained.
Below is a qualitative description of how this function
varies. For a stationary dome, the thinning function can be
written:
T ¼
1 À
m
a
x þ
m
a
ð9:5Þ
with l = m/a the ratio of basal fusion to surface accumulation and with x the standard vertical profile of horizontal
flow (see Parrenin et al. 2007b, for details). x varies almost
linearly from 0 at the ice base interface to 1 at the surface,
because the deformation is concentrated at the base of glacier. For certain domes, the Raymond effect causes more
deformation at the top of the ice and therefore a less linear x
profile.
In a non-stationary case, variations in the thickness of the
ice (related to climatic variations) cause bumps in the thinning function (Fig. 9.10). Moreover, for ice core drilled
along the flow line, like Vostok, the ice comes from
upstream and more complex deformation effects exist. The
parameter that most influences the thinning function is the
thickness of ice at the place of origin of the ice: if this
thickness is large compared to the thickness at the drill site,
then the column of ice has become compressed overall,
resulting in a strong thinning (that is, a low thinning function). And reciprocally.
The Limitations of Modeling
Unfortunately, dating using models becomes increasingly
inaccurate as it approaches the base of the ice cap, for various reasons. Firstly, the mechanical properties of the ice are
not perfectly understood. They depend not only on pressure
and temperature conditions, but also on the size and orientation of the crystals that make up the ice. Secondly, the
conditions at the base of the bedrock cannot be measured
directly in situ. Finally, the lateral conditions throughout the
past, the outcome of a large-scale model, may also be tainted
by a significant error. These lateral conditions determine the
position of the domes and dividing lines in the domain, and
therefore the direction of the ice particles.
Fig. 9.10 Thinning functions for ice cores from Dome C (Parrenin et al. 2007b), Dome Fuji (Parrenin et al. 2007a) and Vostok (Parrenin et al.
2004)
132
F. Parrenin