

Antarctic Dronning Maud Land site (EDML). This core,
because of its location, recorded the climate of the South
Atlantic, with a resolution comparable to that of the Greenland ice cores. After synchronization, once again based on
methane, it appears that all the warm events perfectly reflect
the Dansgaard-Oeschger events in Greenland: the seesaw
mechanism therefore also works on short time scales.
A study of marine cores from the South Indian ocean
showed how the interhemispheric seesaw mechanism also
concerns the Antarctic Circum Current (Mazaud et al. 2007).
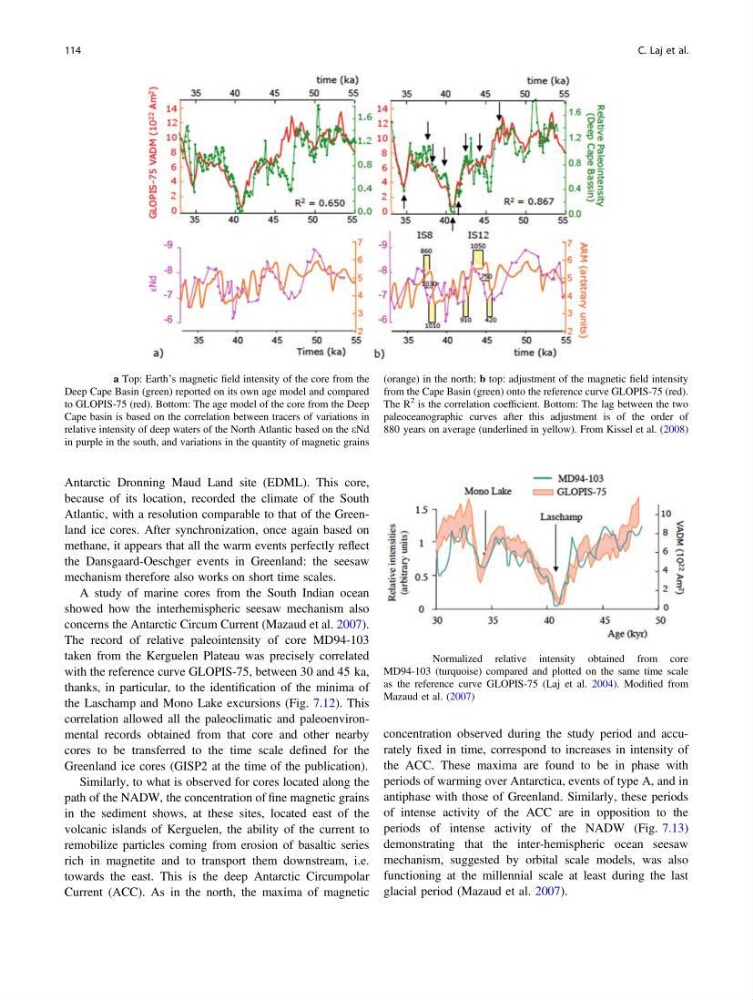
The record of relative paleointensity of core MD94-103
taken from the Kerguelen Plateau was precisely correlated
with the reference curve GLOPIS-75, between 30 and 45 ka,
thanks, in particular, to the identification of the minima of
the Laschamp and Mono Lake excursions (Fig. 7.12). This
correlation allowed all the paleoclimatic and paleoenvironmental records obtained from that core and other nearby
cores to be transferred to the time scale defined for the
Greenland ice cores (GISP2 at the time of the publication).
Similarly, to what is observed for cores located along the
path of the NADW, the concentration of fine magnetic grains
in the sediment shows, at these sites, located east of the
volcanic islands of Kerguelen, the ability of the current to
remobilize particles coming from erosion of basaltic series
rich in magnetite and to transport them downstream, i.e.
towards the east. This is the deep Antarctic Circumpolar
Current (ACC). As in the north, the maxima of magnetic
concentration observed during the study period and accurately fixed in time, correspond to increases in intensity of
the ACC. These maxima are found to be in phase with
periods of warming over Antarctica, events of type A, and in
antiphase with those of Greenland. Similarly, these periods
of intense activity of the ACC are in opposition to the
periods of intense activity of the NADW (Fig. 7.13)
demonstrating that the inter-hemispheric ocean seesaw
mechanism, suggested by orbital scale models, was also
functioning at the millennial scale at least during the last
glacial period (Mazaud et al. 2007).
Fig. 7.11 a Top: Earth’s magnetic field intensity of the core from the
Deep Cape Basin (green) reported on its own age model and compared
to GLOPIS-75 (red). Bottom: The age model of the core from the Deep
Cape basin is based on the correlation between tracers of variations in
relative intensity of deep waters of the North Atlantic based on the eNd
in purple in the south, and variations in the quantity of magnetic grains
(orange) in the north; b top: adjustment of the magnetic field intensity
from the Cape Basin (green) onto the reference curve GLOPIS-75 (red).
The R
2 is the correlation coefficient. Bottom: The lag between the two
paleoceanographic curves after this adjustment is of the order of
880 years on average (underlined in yellow). From Kissel et al. (2008)
Fig. 7.12 Normalized relative intensity obtained from core
MD94-103 (turquoise) compared and plotted on the same time scale
as the reference curve GLOPIS-75 (Laj et al. 2004). Modified from
Mazaud et al. (2007)
114
C. Laj et al.
because of its location, recorded the climate of the South
Atlantic, with a resolution comparable to that of the Greenland ice cores. After synchronization, once again based on
methane, it appears that all the warm events perfectly reflect
the Dansgaard-Oeschger events in Greenland: the seesaw
mechanism therefore also works on short time scales.
A study of marine cores from the South Indian ocean
showed how the interhemispheric seesaw mechanism also
concerns the Antarctic Circum Current (Mazaud et al. 2007).
The record of relative paleointensity of core MD94-103
taken from the Kerguelen Plateau was precisely correlated
with the reference curve GLOPIS-75, between 30 and 45 ka,
thanks, in particular, to the identification of the minima of
the Laschamp and Mono Lake excursions (Fig. 7.12). This
correlation allowed all the paleoclimatic and paleoenvironmental records obtained from that core and other nearby
cores to be transferred to the time scale defined for the
Greenland ice cores (GISP2 at the time of the publication).
Similarly, to what is observed for cores located along the
path of the NADW, the concentration of fine magnetic grains
in the sediment shows, at these sites, located east of the
volcanic islands of Kerguelen, the ability of the current to
remobilize particles coming from erosion of basaltic series
rich in magnetite and to transport them downstream, i.e.
towards the east. This is the deep Antarctic Circumpolar
Current (ACC). As in the north, the maxima of magnetic
concentration observed during the study period and accurately fixed in time, correspond to increases in intensity of
the ACC. These maxima are found to be in phase with
periods of warming over Antarctica, events of type A, and in
antiphase with those of Greenland. Similarly, these periods
of intense activity of the ACC are in opposition to the
periods of intense activity of the NADW (Fig. 7.13)
demonstrating that the inter-hemispheric ocean seesaw
mechanism, suggested by orbital scale models, was also
functioning at the millennial scale at least during the last
glacial period (Mazaud et al. 2007).
Fig. 7.11 a Top: Earth’s magnetic field intensity of the core from the
Deep Cape Basin (green) reported on its own age model and compared
to GLOPIS-75 (red). Bottom: The age model of the core from the Deep
Cape basin is based on the correlation between tracers of variations in
relative intensity of deep waters of the North Atlantic based on the eNd
in purple in the south, and variations in the quantity of magnetic grains
(orange) in the north; b top: adjustment of the magnetic field intensity
from the Cape Basin (green) onto the reference curve GLOPIS-75 (red).
The R
2 is the correlation coefficient. Bottom: The lag between the two
paleoceanographic curves after this adjustment is of the order of
880 years on average (underlined in yellow). From Kissel et al. (2008)
Fig. 7.12 Normalized relative intensity obtained from core
MD94-103 (turquoise) compared and plotted on the same time scale
as the reference curve GLOPIS-75 (Laj et al. 2004). Modified from
Mazaud et al. (2007)
114
C. Laj et al.