

Conclusions
During the years 1960–1980, the main objective of paleomagnetic studies of marine sediments and of the magnetization
of the oceanic crust was to establish the sequence of magnetic
polarities. The resultant magnetostratigraphic scale, whose
basic features were well established by the late 1970s, constitutes a huge step forward in an impressive number of stratigraphic studies as well as tectonic studies focused in specific
geographic areas or more globally at the scale of plate tectonics.
In its original form, magnetic stratigraphy, based on
identifying polarity reversals of the geomagnetic field, typically had a million years as its unit of time.
The discovery, followed by the accurate documentation
of geomagnetic excursions, was an important first development, by providing tie points of well-defined age and very
short duration.
The scale of geomagnetic polarity reversals resolves the
time intervals of the order of several hundreds of thousands
of years and the short instabilities like excursions allow a
resolution of a few hundreds of centuries to be achieved.
Furthermore, the significant decrease in the intensity of the
total geomagnetic field, documented in sediments during
excursions, permitted a first connection with other natural
archives such as ice cores from Greenland or Antarctica. The
reduction in the field led to an increase in the production and
therefore flux of cosmogenic isotopes such as
10 Be,
36 Cl and
14 C, arriving at the surface after their formation in the upper
atmosphere, whose concentration is accurately measured in
ice.
Finally, in recent years, identification of paleointensity
profiles in sedimentary sequences provides an extremely
accurate means of correlation. This opened up a new phase,
still in development, of high-resolution magnetic stratigraphy. Since the understanding of mechanisms of climate
change through the analysis of phase shifts between hemispheres and/or between low and high latitudes is of critical
importance, it is clearly essential to dispose of a correlation
tool independent of climate with a resolution of about a few
hundred years.
By facilitating the unification of time scales for different
types of records, both continental and oceanic, high resolution magnetic stratigraphy, based on changes in the relative
intensity of the field contributes to a better understanding of
the chronology and dynamics of mechanisms responsible for
climate and geomagnetic variations at the scale of the recent
Quaternary, between 0 and 500 ka.
References
Andersen, K. K., et al. (2006). The greenland ice core chronology 2005,
15–42 ka. Part 1: Constructing the time scale. Quaternary Science
Reviews, 25, 3246–3257.
Blunier, T., & Brook, E. J. (2001). Timing of millennial-scale climate
change in antarctica and greenland during the last glacial period.
Science, 291, 109–112.
Bond, G., et al. (1993). Correlation between climate records from North
Atlantic sediments and Greenland ice. Nature, 365, 143–147.
Bonhommet, N., & Babkine, J. (1967). Sur la présence d’aimantation
inverse dans la Chaîne des Puys. Comptes rendus des séances de
l’Académie des sciences, série B, 264, 92–94.
Broecker, W. S. (1998). Paleocean circulation during the last
deglaciation: A bipolar see-saw? Paleoceanography, 13, 119–121.
Brunhes, B. (1906). Recherches sur la direction de l’aimantation des
roches volcaniques. Journal de physique, V, 705–724.
Cande, S. C., & Kent, D. V. (1992). A new geomagnetic polarity
timescale for the late cretaceous and cenozoic. Journal of
Geophysical Research, 97, 13917–13951.
Cande, S. C., & Kent, D. V. (1995). Revised calibration of the
geomagnetic polarity timescale for the late cretaceous and cenozoic.
Journal of Geophysical Research, 100, 6093–6095.
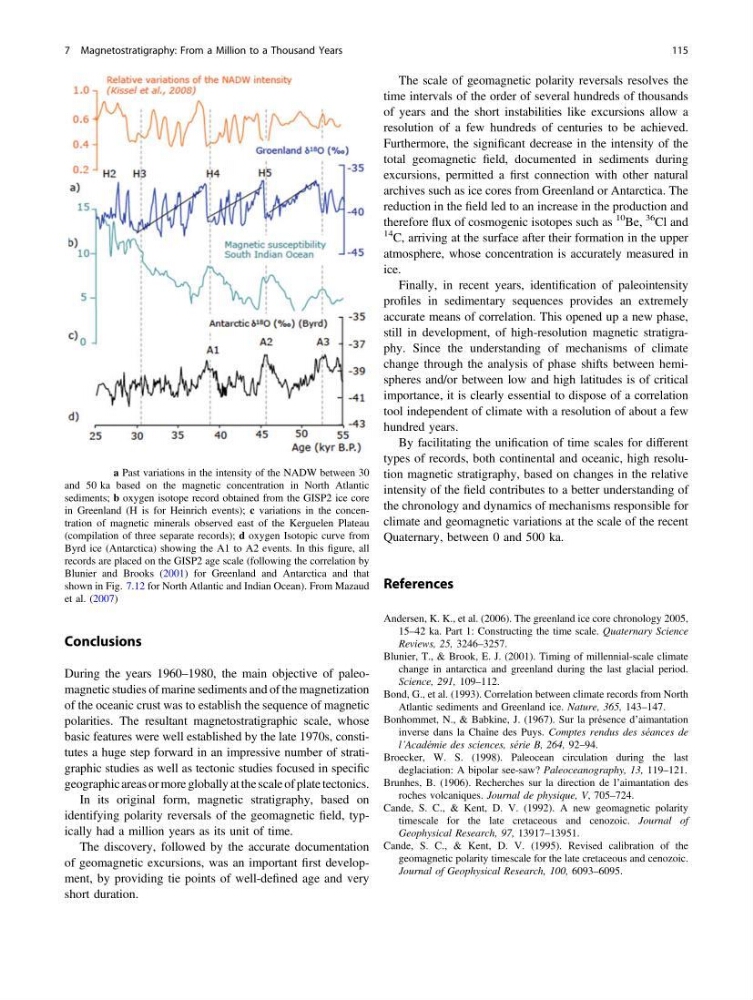
Fig. 7.13 a Past variations in the intensity of the NADW between 30
and 50 ka based on the magnetic concentration in North Atlantic
sediments; b oxygen isotope record obtained from the GISP2 ice core
in Greenland (H is for Heinrich events); c variations in the concentration of magnetic minerals observed east of the Kerguelen Plateau
(compilation of three separate records); d oxygen Isotopic curve from
Byrd ice (Antarctica) showing the A1 to A2 events. In this figure, all
records are placed on the GISP2 age scale (following the correlation by
Blunier and Brooks (2001) for Greenland and Antarctica and that
shown in Fig. 7.12 for North Atlantic and Indian Ocean). From Mazaud
et al. (2007)
7 Magnetostratigraphy: From a Million to a Thousand Years
115
During the years 1960–1980, the main objective of paleomagnetic studies of marine sediments and of the magnetization
of the oceanic crust was to establish the sequence of magnetic
polarities. The resultant magnetostratigraphic scale, whose
basic features were well established by the late 1970s, constitutes a huge step forward in an impressive number of stratigraphic studies as well as tectonic studies focused in specific
geographic areas or more globally at the scale of plate tectonics.
In its original form, magnetic stratigraphy, based on
identifying polarity reversals of the geomagnetic field, typically had a million years as its unit of time.
The discovery, followed by the accurate documentation
of geomagnetic excursions, was an important first development, by providing tie points of well-defined age and very
short duration.
The scale of geomagnetic polarity reversals resolves the
time intervals of the order of several hundreds of thousands
of years and the short instabilities like excursions allow a
resolution of a few hundreds of centuries to be achieved.
Furthermore, the significant decrease in the intensity of the
total geomagnetic field, documented in sediments during
excursions, permitted a first connection with other natural
archives such as ice cores from Greenland or Antarctica. The
reduction in the field led to an increase in the production and
therefore flux of cosmogenic isotopes such as
10 Be,
36 Cl and
14 C, arriving at the surface after their formation in the upper
atmosphere, whose concentration is accurately measured in
ice.
Finally, in recent years, identification of paleointensity
profiles in sedimentary sequences provides an extremely
accurate means of correlation. This opened up a new phase,
still in development, of high-resolution magnetic stratigraphy. Since the understanding of mechanisms of climate
change through the analysis of phase shifts between hemispheres and/or between low and high latitudes is of critical
importance, it is clearly essential to dispose of a correlation
tool independent of climate with a resolution of about a few
hundred years.
By facilitating the unification of time scales for different
types of records, both continental and oceanic, high resolution magnetic stratigraphy, based on changes in the relative
intensity of the field contributes to a better understanding of
the chronology and dynamics of mechanisms responsible for
climate and geomagnetic variations at the scale of the recent
Quaternary, between 0 and 500 ka.
References
Andersen, K. K., et al. (2006). The greenland ice core chronology 2005,
15–42 ka. Part 1: Constructing the time scale. Quaternary Science
Reviews, 25, 3246–3257.
Blunier, T., & Brook, E. J. (2001). Timing of millennial-scale climate
change in antarctica and greenland during the last glacial period.
Science, 291, 109–112.
Bond, G., et al. (1993). Correlation between climate records from North
Atlantic sediments and Greenland ice. Nature, 365, 143–147.
Bonhommet, N., & Babkine, J. (1967). Sur la présence d’aimantation
inverse dans la Chaîne des Puys. Comptes rendus des séances de
l’Académie des sciences, série B, 264, 92–94.
Broecker, W. S. (1998). Paleocean circulation during the last
deglaciation: A bipolar see-saw? Paleoceanography, 13, 119–121.
Brunhes, B. (1906). Recherches sur la direction de l’aimantation des
roches volcaniques. Journal de physique, V, 705–724.
Cande, S. C., & Kent, D. V. (1992). A new geomagnetic polarity
timescale for the late cretaceous and cenozoic. Journal of
Geophysical Research, 97, 13917–13951.
Cande, S. C., & Kent, D. V. (1995). Revised calibration of the
geomagnetic polarity timescale for the late cretaceous and cenozoic.
Journal of Geophysical Research, 100, 6093–6095.
Fig. 7.13 a Past variations in the intensity of the NADW between 30
and 50 ka based on the magnetic concentration in North Atlantic
sediments; b oxygen isotope record obtained from the GISP2 ice core
in Greenland (H is for Heinrich events); c variations in the concentration of magnetic minerals observed east of the Kerguelen Plateau
(compilation of three separate records); d oxygen Isotopic curve from
Byrd ice (Antarctica) showing the A1 to A2 events. In this figure, all
records are placed on the GISP2 age scale (following the correlation by
Blunier and Brooks (2001) for Greenland and Antarctica and that
shown in Fig. 7.12 for North Atlantic and Indian Ocean). From Mazaud
et al. (2007)
7 Magnetostratigraphy: From a Million to a Thousand Years
115