

414
Z. Li et al.
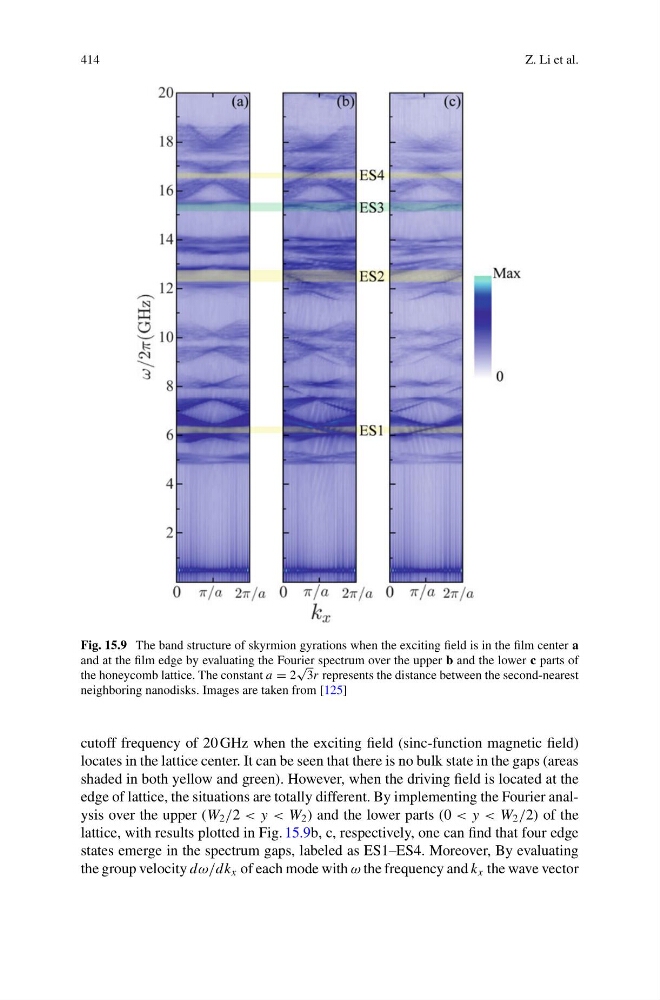
Fig. 15.9 The band structure of skyrmion gyrations when the exciting field is in the film center a
and at the film edge by evaluating the Fourier spectrum over the upper b and the lower c parts of
the honeycomb lattice. The constant a = 2
√
3r represents the distance between the second-nearest
neighboring nanodisks. Images are taken from [125]
cutoff frequency of 20 GHz when the exciting field (sinc-function magnetic field)
locates in the lattice center. It can be seen that there is no bulk state in the gaps (areas
shaded in both yellow and green). However, when the driving field is located at the
edge of lattice, the situations are totally different. By implementing the Fourier analysis over the upper (W 2 /2 < y < W 2 ) and the lower parts (0 < y < W 2 /2) of the
lattice, with results plotted in Fig. 15.9b, c, respectively, one can find that four edge
states emerge in the spectrum gaps, labeled as ES1–ES4. Moreover, By evaluating
the group velocity dω/dk x of each mode with ω the frequency and k x the wave vector
Z. Li et al.
Fig. 15.9 The band structure of skyrmion gyrations when the exciting field is in the film center a
and at the film edge by evaluating the Fourier spectrum over the upper b and the lower c parts of
the honeycomb lattice. The constant a = 2
√
3r represents the distance between the second-nearest
neighboring nanodisks. Images are taken from [125]
cutoff frequency of 20 GHz when the exciting field (sinc-function magnetic field)
locates in the lattice center. It can be seen that there is no bulk state in the gaps (areas
shaded in both yellow and green). However, when the driving field is located at the
edge of lattice, the situations are totally different. By implementing the Fourier analysis over the upper (W 2 /2 < y < W 2 ) and the lower parts (0 < y < W 2 /2) of the
lattice, with results plotted in Fig. 15.9b, c, respectively, one can find that four edge
states emerge in the spectrum gaps, labeled as ES1–ES4. Moreover, By evaluating
the group velocity dω/dk x of each mode with ω the frequency and k x the wave vector