

5 Light–Nanomatter Chiral Interaction in Optical-Force Effects
113
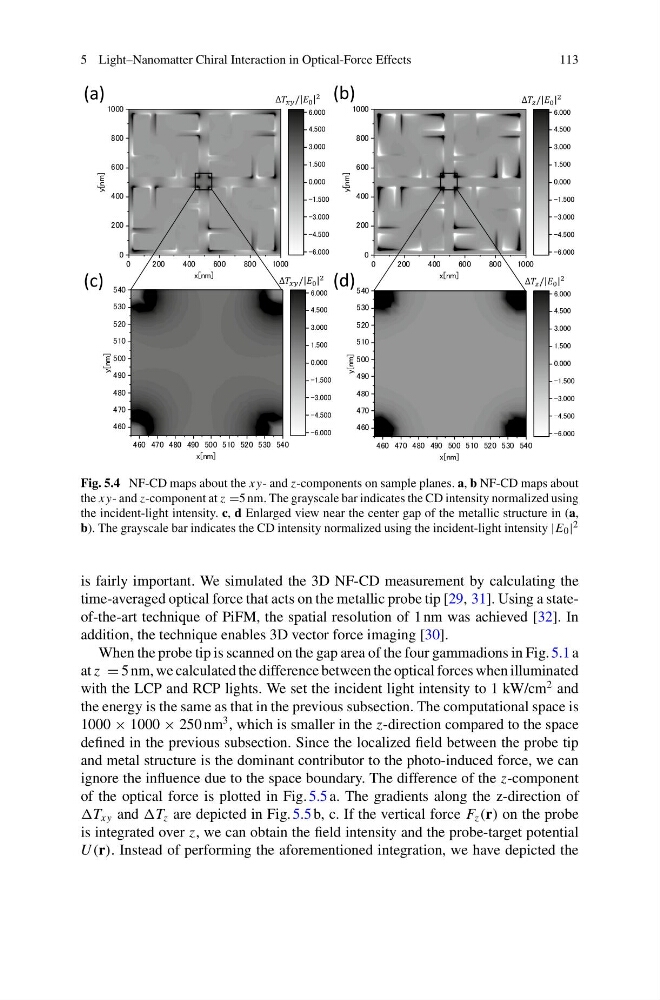
Fig. 5.4 NF-CD maps about the xy- and z-components on sample planes. a, b NF-CD maps about
the xy- and z-component at z =5 nm. The grayscale bar indicates the CD intensity normalized using
the incident-light intensity. c, d Enlarged view near the center gap of the metallic structure in (a,
b). The grayscale bar indicates the CD intensity normalized using the incident-light intensity |E 0 | 2
is fairly important. We simulated the 3D NF-CD measurement by calculating the
time-averaged optical force that acts on the metallic probe tip [29, 31]. Using a stateof-the-art technique of PiFM, the spatial resolution of 1 nm was achieved [32]. In
addition, the technique enables 3D vector force imaging [30].
When the probe tip is scanned on the gap area of the four gammadions in Fig. 5.1 a
at z = 5 nm, we calculated the difference between the optical forces when illuminated
with the LCP and RCP lights. We set the incident light intensity to 1 kW/cm
2 and
the energy is the same as that in the previous subsection. The computational space is
1000 × 1000 × 250 nm
3 , which is smaller in the z-direction compared to the space
defined in the previous subsection. Since the localized field between the probe tip
and metal structure is the dominant contributor to the photo-induced force, we can
ignore the influence due to the space boundary. The difference of the z-component
of the optical force is plotted in Fig. 5.5 a. The gradients along the z-direction of
xy and z are depicted in Fig. 5.5 b, c. If the vertical force F z (r) on the probe
is integrated over z, we can obtain the field intensity and the probe-target potential
U (r). Instead of performing the aforementioned integration, we have depicted the
113
Fig. 5.4 NF-CD maps about the xy- and z-components on sample planes. a, b NF-CD maps about
the xy- and z-component at z =5 nm. The grayscale bar indicates the CD intensity normalized using
the incident-light intensity. c, d Enlarged view near the center gap of the metallic structure in (a,
b). The grayscale bar indicates the CD intensity normalized using the incident-light intensity |E 0 | 2
is fairly important. We simulated the 3D NF-CD measurement by calculating the
time-averaged optical force that acts on the metallic probe tip [29, 31]. Using a stateof-the-art technique of PiFM, the spatial resolution of 1 nm was achieved [32]. In
addition, the technique enables 3D vector force imaging [30].
When the probe tip is scanned on the gap area of the four gammadions in Fig. 5.1 a
at z = 5 nm, we calculated the difference between the optical forces when illuminated
with the LCP and RCP lights. We set the incident light intensity to 1 kW/cm
2 and
the energy is the same as that in the previous subsection. The computational space is
1000 × 1000 × 250 nm
3 , which is smaller in the z-direction compared to the space
defined in the previous subsection. Since the localized field between the probe tip
and metal structure is the dominant contributor to the photo-induced force, we can
ignore the influence due to the space boundary. The difference of the z-component
of the optical force is plotted in Fig. 5.5 a. The gradients along the z-direction of
xy and z are depicted in Fig. 5.5 b, c. If the vertical force F z (r) on the probe
is integrated over z, we can obtain the field intensity and the probe-target potential
U (r). Instead of performing the aforementioned integration, we have depicted the