

114
H. Ishihara et al.
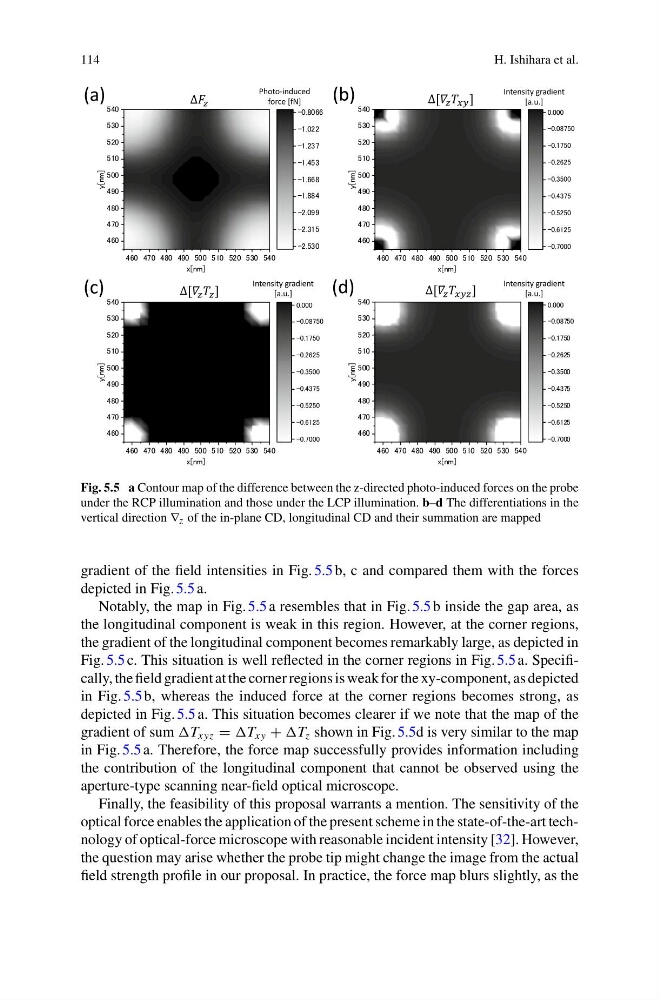
Fig. 5.5 a Contour map of the difference between the z-directed photo-induced forces on the probe
under the RCP illumination and those under the LCP illumination. b–d The differentiations in the
vertical direction ∇ z of the in-plane CD, longitudinal CD and their summation are mapped
gradient of the field intensities in Fig. 5.5 b, c and compared them with the forces
depicted in Fig. 5.5 a.
Notably, the map in Fig. 5.5 a resembles that in Fig. 5.5 b inside the gap area, as
the longitudinal component is weak in this region. However, at the corner regions,
the gradient of the longitudinal component becomes remarkably large, as depicted in
Fig. 5.5 c. This situation is well reflected in the corner regions in Fig. 5.5 a. Specifically, the field gradient at the corner regions is weak for the xy-component, as depicted
in Fig. 5.5 b, whereas the induced force at the corner regions becomes strong, as
depicted in Fig. 5.5 a. This situation becomes clearer if we note that the map of the
gradient of sum xyz = xy + z shown in Fig. 5.5d is very similar to the map
in Fig. 5.5 a. Therefore, the force map successfully provides information including
the contribution of the longitudinal component that cannot be observed using the
aperture-type scanning near-field optical microscope.
Finally, the feasibility of this proposal warrants a mention. The sensitivity of the
optical force enables the application of the present scheme in the state-of-the-art technology of optical-force microscope with reasonable incident intensity [32]. However,
the question may arise whether the probe tip might change the image from the actual
field strength profile in our proposal. In practice, the force map blurs slightly, as the
H. Ishihara et al.
Fig. 5.5 a Contour map of the difference between the z-directed photo-induced forces on the probe
under the RCP illumination and those under the LCP illumination. b–d The differentiations in the
vertical direction ∇ z of the in-plane CD, longitudinal CD and their summation are mapped
gradient of the field intensities in Fig. 5.5 b, c and compared them with the forces
depicted in Fig. 5.5 a.
Notably, the map in Fig. 5.5 a resembles that in Fig. 5.5 b inside the gap area, as
the longitudinal component is weak in this region. However, at the corner regions,
the gradient of the longitudinal component becomes remarkably large, as depicted in
Fig. 5.5 c. This situation is well reflected in the corner regions in Fig. 5.5 a. Specifically, the field gradient at the corner regions is weak for the xy-component, as depicted
in Fig. 5.5 b, whereas the induced force at the corner regions becomes strong, as
depicted in Fig. 5.5 a. This situation becomes clearer if we note that the map of the
gradient of sum xyz = xy + z shown in Fig. 5.5d is very similar to the map
in Fig. 5.5 a. Therefore, the force map successfully provides information including
the contribution of the longitudinal component that cannot be observed using the
aperture-type scanning near-field optical microscope.
Finally, the feasibility of this proposal warrants a mention. The sensitivity of the
optical force enables the application of the present scheme in the state-of-the-art technology of optical-force microscope with reasonable incident intensity [32]. However,
the question may arise whether the probe tip might change the image from the actual
field strength profile in our proposal. In practice, the force map blurs slightly, as the