

5 Light–Nanomatter Chiral Interaction in Optical-Force Effects
111
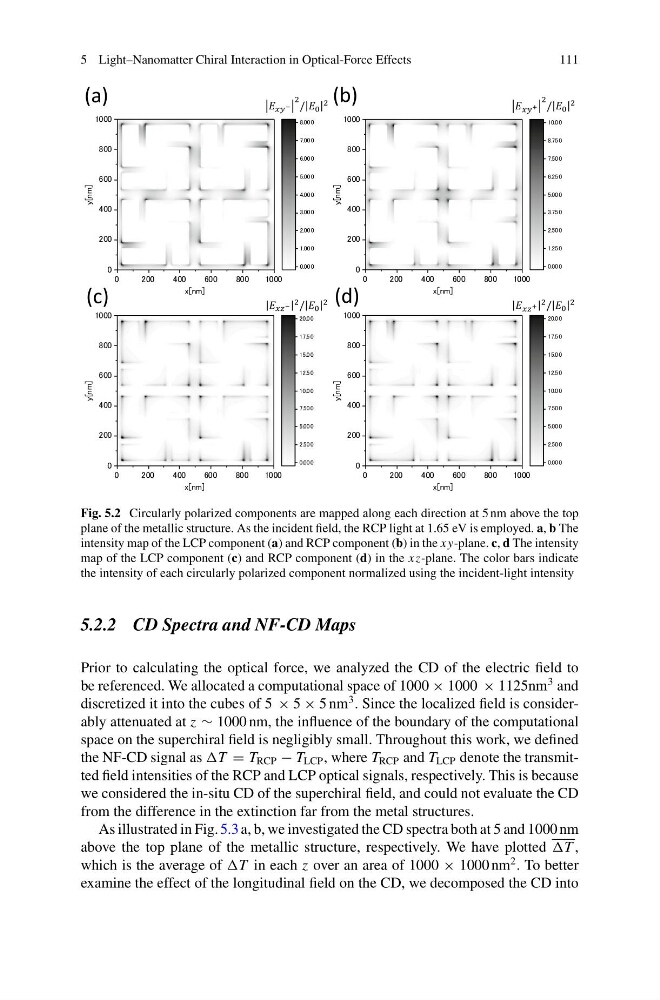
Fig. 5.2 Circularly polarized components are mapped along each direction at 5 nm above the top
plane of the metallic structure. As the incident field, the RCP light at 1.65 eV is employed. a, b The
intensity map of the LCP component (a) and RCP component (b) in the xy-plane. c, d The intensity
map of the LCP component (c) and RCP component (d) in the xz-plane. The color bars indicate
the intensity of each circularly polarized component normalized using the incident-light intensity
5.2.2 CD Spectra and NF-CD Maps
Prior to calculating the optical force, we analyzed the CD of the electric field to
be referenced. We allocated a computational space of 1000 × 1000 × 1125nm
3 and
discretized it into the cubes of 5 × 5 × 5 nm
3 . Since the localized field is considerably attenuated at z ∼ 1000 nm, the influence of the boundary of the computational
space on the superchiral field is negligibly small. Throughout this work, we defined
the NF-CD signal as = T RCP − T LCP , where T RCP and T LCP denote the transmitted field intensities of the RCP and LCP optical signals, respectively. This is because
we considered the in-situ CD of the superchiral field, and could not evaluate the CD
from the difference in the extinction far from the metal structures.
As illustrated in Fig. 5.3 a, b, we investigated the CD spectra both at 5 and 1000 nm
above the top plane of the metallic structure, respectively. We have plotted ,
which is the average of in each z over an area of 1000 × 1000 nm
2 . To better
examine the effect of the longitudinal field on the CD, we decomposed the CD into
111
Fig. 5.2 Circularly polarized components are mapped along each direction at 5 nm above the top
plane of the metallic structure. As the incident field, the RCP light at 1.65 eV is employed. a, b The
intensity map of the LCP component (a) and RCP component (b) in the xy-plane. c, d The intensity
map of the LCP component (c) and RCP component (d) in the xz-plane. The color bars indicate
the intensity of each circularly polarized component normalized using the incident-light intensity
5.2.2 CD Spectra and NF-CD Maps
Prior to calculating the optical force, we analyzed the CD of the electric field to
be referenced. We allocated a computational space of 1000 × 1000 × 1125nm
3 and
discretized it into the cubes of 5 × 5 × 5 nm
3 . Since the localized field is considerably attenuated at z ∼ 1000 nm, the influence of the boundary of the computational
space on the superchiral field is negligibly small. Throughout this work, we defined
the NF-CD signal as = T RCP − T LCP , where T RCP and T LCP denote the transmitted field intensities of the RCP and LCP optical signals, respectively. This is because
we considered the in-situ CD of the superchiral field, and could not evaluate the CD
from the difference in the extinction far from the metal structures.
As illustrated in Fig. 5.3 a, b, we investigated the CD spectra both at 5 and 1000 nm
above the top plane of the metallic structure, respectively. We have plotted ,
which is the average of in each z over an area of 1000 × 1000 nm
2 . To better
examine the effect of the longitudinal field on the CD, we decomposed the CD into