

19 Mud Shrinkage and Cracking Phenomenon Experimental …
395
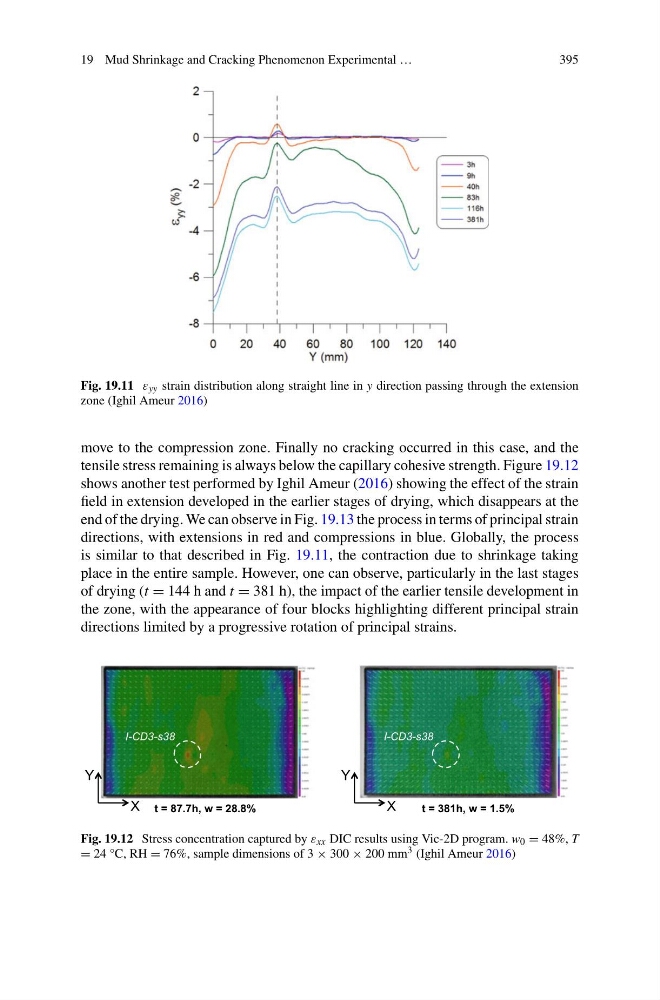
Fig. 19.11 ε yy strain distribution along straight line in y direction passing through the extension
zone (Ighil Ameur 2016)
move to the compression zone. Finally no cracking occurred in this case, and the
tensile stress remaining is always below the capillary cohesive strength. Figure 19.12
shows another test performed by Ighil Ameur (2016) showing the effect of the strain
field in extension developed in the earlier stages of drying, which disappears at the
end of the drying. We can observe in Fig. 19.13 the process in terms of principal strain
directions, with extensions in red and compressions in blue. Globally, the process
is similar to that described in Fig. 19.11, the contraction due to shrinkage taking
place in the entire sample. However, one can observe, particularly in the last stages
of drying (t = 144 h and t = 381 h), the impact of the earlier tensile development in
the zone, with the appearance of four blocks highlighting different principal strain
directions limited by a progressive rotation of principal strains.
t = 381h, w = 1.5%
t = 87.7h, w = 28.8%
I-CD3-s38
I-CD3-s38
X
Y
X
Y
Fig. 19.12 Stress concentration captured by ε xx DIC results using Vic-2D program. w 0 = 48%, T
= 24 °C, RH = 76%, sample dimensions of 3 × 300 × 200 mm 3 (Ighil Ameur 2016)
395
Fig. 19.11 ε yy strain distribution along straight line in y direction passing through the extension
zone (Ighil Ameur 2016)
move to the compression zone. Finally no cracking occurred in this case, and the
tensile stress remaining is always below the capillary cohesive strength. Figure 19.12
shows another test performed by Ighil Ameur (2016) showing the effect of the strain
field in extension developed in the earlier stages of drying, which disappears at the
end of the drying. We can observe in Fig. 19.13 the process in terms of principal strain
directions, with extensions in red and compressions in blue. Globally, the process
is similar to that described in Fig. 19.11, the contraction due to shrinkage taking
place in the entire sample. However, one can observe, particularly in the last stages
of drying (t = 144 h and t = 381 h), the impact of the earlier tensile development in
the zone, with the appearance of four blocks highlighting different principal strain
directions limited by a progressive rotation of principal strains.
t = 381h, w = 1.5%
t = 87.7h, w = 28.8%
I-CD3-s38
I-CD3-s38
X
Y
X
Y
Fig. 19.12 Stress concentration captured by ε xx DIC results using Vic-2D program. w 0 = 48%, T
= 24 °C, RH = 76%, sample dimensions of 3 × 300 × 200 mm 3 (Ighil Ameur 2016)