

394
M. Hattab et al.
d
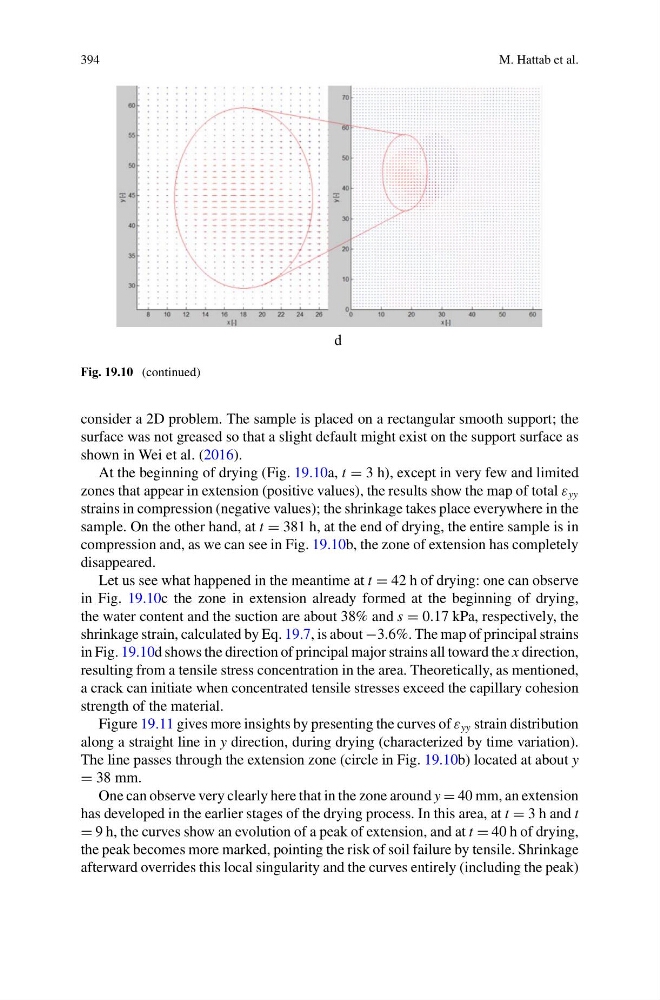
Fig. 19.10 (continued)
consider a 2D problem. The sample is placed on a rectangular smooth support; the
surface was not greased so that a slight default might exist on the support surface as
shown in Wei et al. (2016).
At the beginning of drying (Fig. 19.10a, t = 3 h), except in very few and limited
zones that appear in extension (positive values), the results show the map of total ε yy
strains in compression (negative values); the shrinkage takes place everywhere in the
sample. On the other hand, at t = 381 h, at the end of drying, the entire sample is in
compression and, as we can see in Fig. 19.10b, the zone of extension has completely
disappeared.
Let us see what happened in the meantime at t = 42 h of drying: one can observe
in Fig. 19.10c the zone in extension already formed at the beginning of drying,
the water content and the suction are about 38% and s = 0.17 kPa, respectively, the
shrinkage strain, calculated by Eq. 19.7, is about −3.6%. The map of principal strains
in Fig. 19.10d shows the direction of principal major strains all toward the x direction,
resulting from a tensile stress concentration in the area. Theoretically, as mentioned,
a crack can initiate when concentrated tensile stresses exceed the capillary cohesion
strength of the material.
Figure 19.11 gives more insights by presenting the curves of ε yy strain distribution
along a straight line in y direction, during drying (characterized by time variation).
The line passes through the extension zone (circle in Fig. 19.10b) located at about y
= 38 mm.
One can observe very clearly here that in the zone around y = 40 mm, an extension
has developed in the earlier stages of the drying process. In this area, at t = 3 h and t
= 9 h, the curves show an evolution of a peak of extension, and at t = 40 h of drying,
the peak becomes more marked, pointing the risk of soil failure by tensile. Shrinkage
afterward overrides this local singularity and the curves entirely (including the peak)
M. Hattab et al.
d
Fig. 19.10 (continued)
consider a 2D problem. The sample is placed on a rectangular smooth support; the
surface was not greased so that a slight default might exist on the support surface as
shown in Wei et al. (2016).
At the beginning of drying (Fig. 19.10a, t = 3 h), except in very few and limited
zones that appear in extension (positive values), the results show the map of total ε yy
strains in compression (negative values); the shrinkage takes place everywhere in the
sample. On the other hand, at t = 381 h, at the end of drying, the entire sample is in
compression and, as we can see in Fig. 19.10b, the zone of extension has completely
disappeared.
Let us see what happened in the meantime at t = 42 h of drying: one can observe
in Fig. 19.10c the zone in extension already formed at the beginning of drying,
the water content and the suction are about 38% and s = 0.17 kPa, respectively, the
shrinkage strain, calculated by Eq. 19.7, is about −3.6%. The map of principal strains
in Fig. 19.10d shows the direction of principal major strains all toward the x direction,
resulting from a tensile stress concentration in the area. Theoretically, as mentioned,
a crack can initiate when concentrated tensile stresses exceed the capillary cohesion
strength of the material.
Figure 19.11 gives more insights by presenting the curves of ε yy strain distribution
along a straight line in y direction, during drying (characterized by time variation).
The line passes through the extension zone (circle in Fig. 19.10b) located at about y
= 38 mm.
One can observe very clearly here that in the zone around y = 40 mm, an extension
has developed in the earlier stages of the drying process. In this area, at t = 3 h and t
= 9 h, the curves show an evolution of a peak of extension, and at t = 40 h of drying,
the peak becomes more marked, pointing the risk of soil failure by tensile. Shrinkage
afterward overrides this local singularity and the curves entirely (including the peak)