

396
M. Hattab et al.
X
Y
t = 4h, w = 47.1%
t = 42h, w = 38.2%
t = 381h, w = 1.5%
t = 144h, w = 16.8%
t = 87.7h, w = 28.8%
t = 81h, w = 30.3%
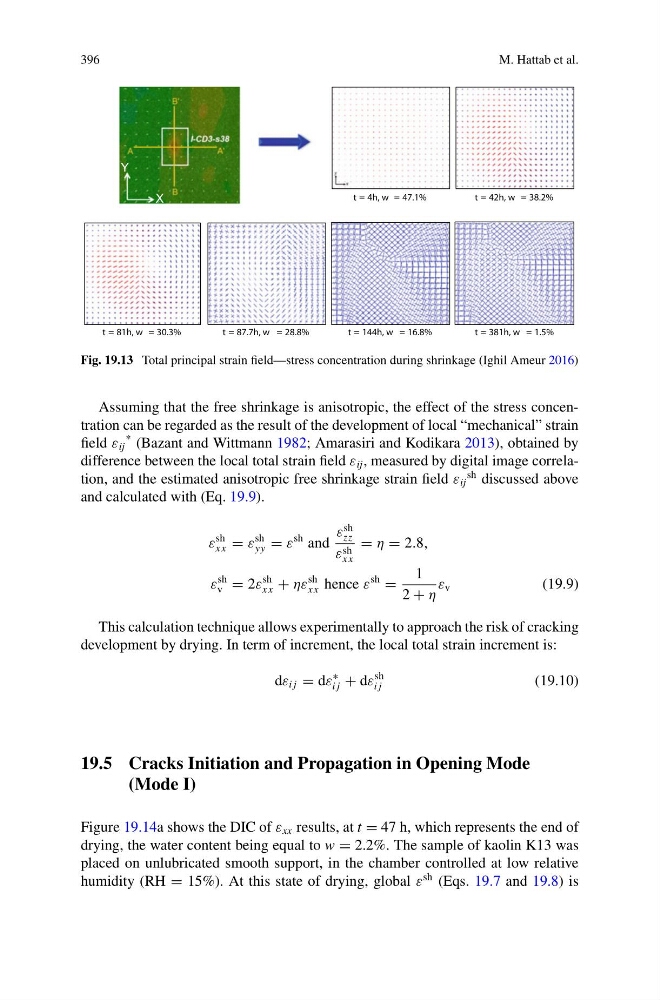
Fig. 19.13 Total principal strain field—stress concentration during shrinkage (Ighil Ameur 2016)
Assuming that the free shrinkage is anisotropic, the effect of the stress concentration can be regarded as the result of the development of local “mechanical” strain
field ε ij
* (Bazant and Wittmann 1982; Amarasiri and Kodikara 2013), obtained by
difference between the local total strain field ε ij , measured by digital image correlation, and the estimated anisotropic free shrinkage strain field ε ij
sh discussed above
and calculated with (Eq. 19.9).
ε
sh
xx = ε
sh
yy = ε
sh and
ε
sh
zz
ε sh
xx
= η = 2.8,
ε
sh
v = 2ε
sh
xx + ηε
sh
xx hence ε
sh
=
1
2 + η
ε v
(19.9)
This calculation technique allows experimentally to approach the risk of cracking
development by drying. In term of increment, the local total strain increment is:
dε i j = dε
∗
i j + dε
sh
i j
(19.10)
19.5 Cracks Initiation and Propagation in Opening Mode
(Mode I)
Figure 19.14a shows the DIC of ε xx results, at t = 47 h, which represents the end of
drying, the water content being equal to w = 2.2%. The sample of kaolin K13 was
placed on unlubricated smooth support, in the chamber controlled at low relative
humidity (RH = 15%). At this state of drying, global ε
sh (Eqs. 19.7 and 19.8) is
M. Hattab et al.
X
Y
t = 4h, w = 47.1%
t = 42h, w = 38.2%
t = 381h, w = 1.5%
t = 144h, w = 16.8%
t = 87.7h, w = 28.8%
t = 81h, w = 30.3%
Fig. 19.13 Total principal strain field—stress concentration during shrinkage (Ighil Ameur 2016)
Assuming that the free shrinkage is anisotropic, the effect of the stress concentration can be regarded as the result of the development of local “mechanical” strain
field ε ij
* (Bazant and Wittmann 1982; Amarasiri and Kodikara 2013), obtained by
difference between the local total strain field ε ij , measured by digital image correlation, and the estimated anisotropic free shrinkage strain field ε ij
sh discussed above
and calculated with (Eq. 19.9).
ε
sh
xx = ε
sh
yy = ε
sh and
ε
sh
zz
ε sh
xx
= η = 2.8,
ε
sh
v = 2ε
sh
xx + ηε
sh
xx hence ε
sh
=
1
2 + η
ε v
(19.9)
This calculation technique allows experimentally to approach the risk of cracking
development by drying. In term of increment, the local total strain increment is:
dε i j = dε
∗
i j + dε
sh
i j
(19.10)
19.5 Cracks Initiation and Propagation in Opening Mode
(Mode I)
Figure 19.14a shows the DIC of ε xx results, at t = 47 h, which represents the end of
drying, the water content being equal to w = 2.2%. The sample of kaolin K13 was
placed on unlubricated smooth support, in the chamber controlled at low relative
humidity (RH = 15%). At this state of drying, global ε
sh (Eqs. 19.7 and 19.8) is