

350
R. dell’Erba
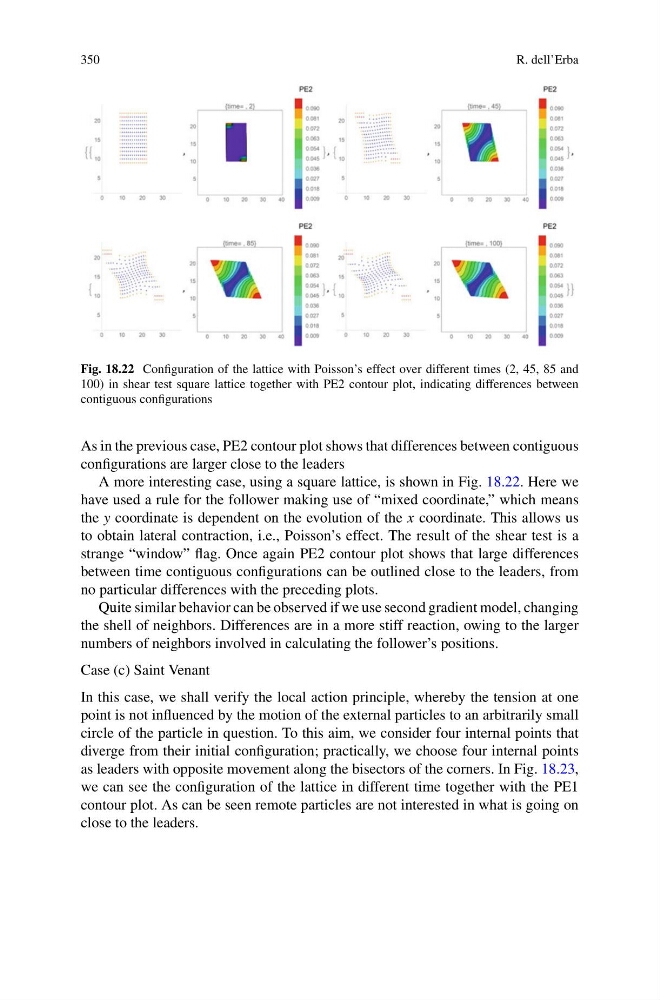
Fig. 18.22 Configuration of the lattice with Poisson’s effect over different times (2, 45, 85 and
100) in shear test square lattice together with PE2 contour plot, indicating differences between
contiguous configurations
As in the previous case, PE2 contour plot shows that differences between contiguous
configurations are larger close to the leaders
A more interesting case, using a square lattice, is shown in Fig. 18.22. Here we
have used a rule for the follower making use of “mixed coordinate,” which means
the y coordinate is dependent on the evolution of the x coordinate. This allows us
to obtain lateral contraction, i.e., Poisson’s effect. The result of the shear test is a
strange “window” flag. Once again PE2 contour plot shows that large differences
between time contiguous configurations can be outlined close to the leaders, from
no particular differences with the preceding plots.
Quite similar behavior can be observed if we use second gradient model, changing
the shell of neighbors. Differences are in a more stiff reaction, owing to the larger
numbers of neighbors involved in calculating the follower’s positions.
Case (c) Saint Venant
In this case, we shall verify the local action principle, whereby the tension at one
point is not influenced by the motion of the external particles to an arbitrarily small
circle of the particle in question. To this aim, we consider four internal points that
diverge from their initial configuration; practically, we choose four internal points
as leaders with opposite movement along the bisectors of the corners. In Fig. 18.23,
we can see the configuration of the lattice in different time together with the PE1
contour plot. As can be seen remote particles are not interested in what is going on
close to the leaders.
R. dell’Erba
Fig. 18.22 Configuration of the lattice with Poisson’s effect over different times (2, 45, 85 and
100) in shear test square lattice together with PE2 contour plot, indicating differences between
contiguous configurations
As in the previous case, PE2 contour plot shows that differences between contiguous
configurations are larger close to the leaders
A more interesting case, using a square lattice, is shown in Fig. 18.22. Here we
have used a rule for the follower making use of “mixed coordinate,” which means
the y coordinate is dependent on the evolution of the x coordinate. This allows us
to obtain lateral contraction, i.e., Poisson’s effect. The result of the shear test is a
strange “window” flag. Once again PE2 contour plot shows that large differences
between time contiguous configurations can be outlined close to the leaders, from
no particular differences with the preceding plots.
Quite similar behavior can be observed if we use second gradient model, changing
the shell of neighbors. Differences are in a more stiff reaction, owing to the larger
numbers of neighbors involved in calculating the follower’s positions.
Case (c) Saint Venant
In this case, we shall verify the local action principle, whereby the tension at one
point is not influenced by the motion of the external particles to an arbitrarily small
circle of the particle in question. To this aim, we consider four internal points that
diverge from their initial configuration; practically, we choose four internal points
as leaders with opposite movement along the bisectors of the corners. In Fig. 18.23,
we can see the configuration of the lattice in different time together with the PE1
contour plot. As can be seen remote particles are not interested in what is going on
close to the leaders.