

18 A Plausible Description of Continuum …
349
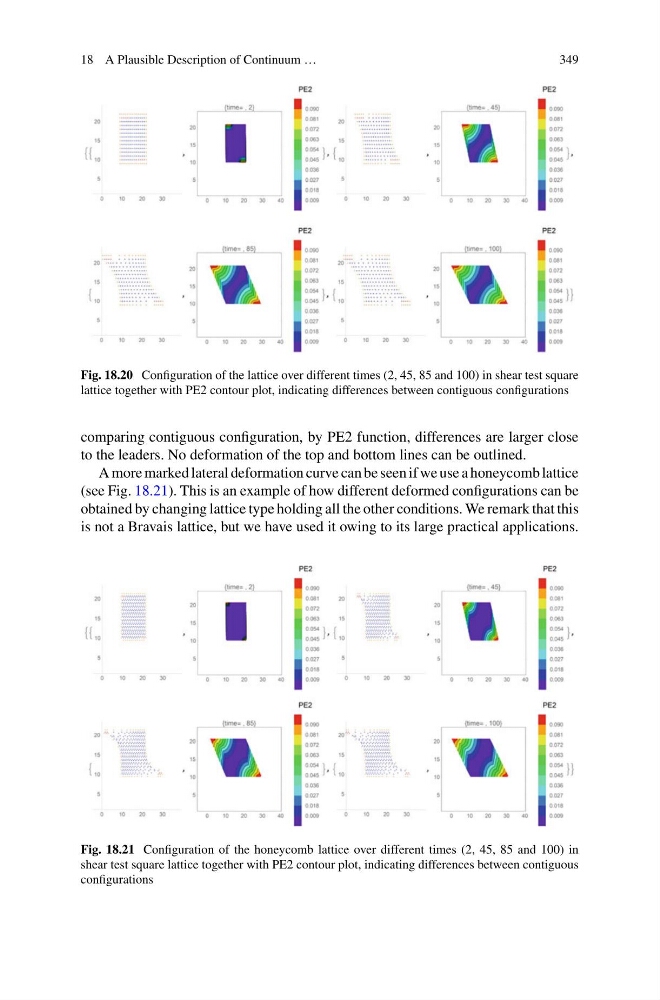
Fig. 18.20 Configuration of the lattice over different times (2, 45, 85 and 100) in shear test square
lattice together with PE2 contour plot, indicating differences between contiguous configurations
comparing contiguous configuration, by PE2 function, differences are larger close
to the leaders. No deformation of the top and bottom lines can be outlined.
A more marked lateral deformation curve can be seen if we use a honeycomb lattice
(see Fig. 18.21). This is an example of how different deformed configurations can be
obtained by changing lattice type holding all the other conditions. We remark that this
is not a Bravais lattice, but we have used it owing to its large practical applications.
Fig. 18.21 Configuration of the honeycomb lattice over different times (2, 45, 85 and 100) in
shear test square lattice together with PE2 contour plot, indicating differences between contiguous
configurations
349
Fig. 18.20 Configuration of the lattice over different times (2, 45, 85 and 100) in shear test square
lattice together with PE2 contour plot, indicating differences between contiguous configurations
comparing contiguous configuration, by PE2 function, differences are larger close
to the leaders. No deformation of the top and bottom lines can be outlined.
A more marked lateral deformation curve can be seen if we use a honeycomb lattice
(see Fig. 18.21). This is an example of how different deformed configurations can be
obtained by changing lattice type holding all the other conditions. We remark that this
is not a Bravais lattice, but we have used it owing to its large practical applications.
Fig. 18.21 Configuration of the honeycomb lattice over different times (2, 45, 85 and 100) in
shear test square lattice together with PE2 contour plot, indicating differences between contiguous
configurations