

16 Strain Gradient Models for Growing Solid Bodies
291
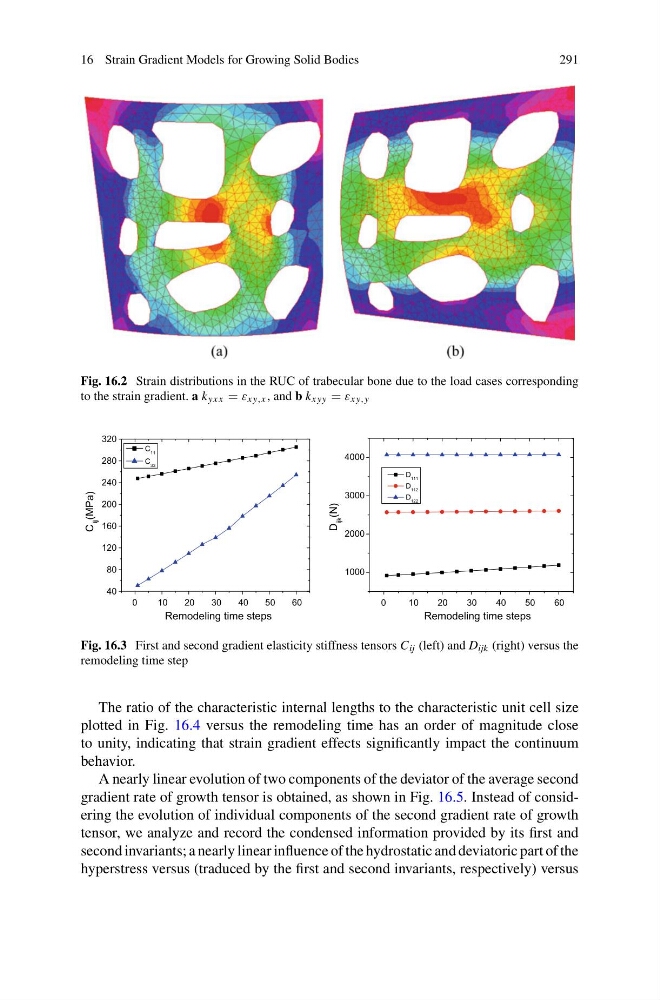
Fig. 16.2 Strain distributions in the RUC of trabecular bone due to the load cases corresponding
to the strain gradient. a k yx x = ε xy,x , and b k xyy = ε xy,y
0
1 0
2 0
3 0
4 0
5 0
6 0
40
80
120
160
200
240
280
320
C
ij
(MPa)
Remodeling time steps
C 11
C 33
0
1 0
2 0
3 0
4 0
5 0
6 0
1000
2000
3000
4000
Remodeling time steps
D
ijk
(N)
D 111
D 112
D 122
Fig. 16.3 First and second gradient elasticity stiffness tensors C ij (left) and D ijk (right) versus the
remodeling time step
The ratio of the characteristic internal lengths to the characteristic unit cell size
plotted in Fig. 16.4 versus the remodeling time has an order of magnitude close
to unity, indicating that strain gradient effects significantly impact the continuum
behavior.
A nearly linear evolution of two components of the deviator of the average second
gradient rate of growth tensor is obtained, as shown in Fig. 16.5. Instead of considering the evolution of individual components of the second gradient rate of growth
tensor, we analyze and record the condensed information provided by its first and
second invariants; a nearly linear influence of the hydrostatic and deviatoric part of the
hyperstress versus (traduced by the first and second invariants, respectively) versus
291
Fig. 16.2 Strain distributions in the RUC of trabecular bone due to the load cases corresponding
to the strain gradient. a k yx x = ε xy,x , and b k xyy = ε xy,y
0
1 0
2 0
3 0
4 0
5 0
6 0
40
80
120
160
200
240
280
320
C
ij
(MPa)
Remodeling time steps
C 11
C 33
0
1 0
2 0
3 0
4 0
5 0
6 0
1000
2000
3000
4000
Remodeling time steps
D
ijk
(N)
D 111
D 112
D 122
Fig. 16.3 First and second gradient elasticity stiffness tensors C ij (left) and D ijk (right) versus the
remodeling time step
The ratio of the characteristic internal lengths to the characteristic unit cell size
plotted in Fig. 16.4 versus the remodeling time has an order of magnitude close
to unity, indicating that strain gradient effects significantly impact the continuum
behavior.
A nearly linear evolution of two components of the deviator of the average second
gradient rate of growth tensor is obtained, as shown in Fig. 16.5. Instead of considering the evolution of individual components of the second gradient rate of growth
tensor, we analyze and record the condensed information provided by its first and
second invariants; a nearly linear influence of the hydrostatic and deviatoric part of the
hyperstress versus (traduced by the first and second invariants, respectively) versus