

9 Computer Simulation of the Process of Loss of Stability …
131
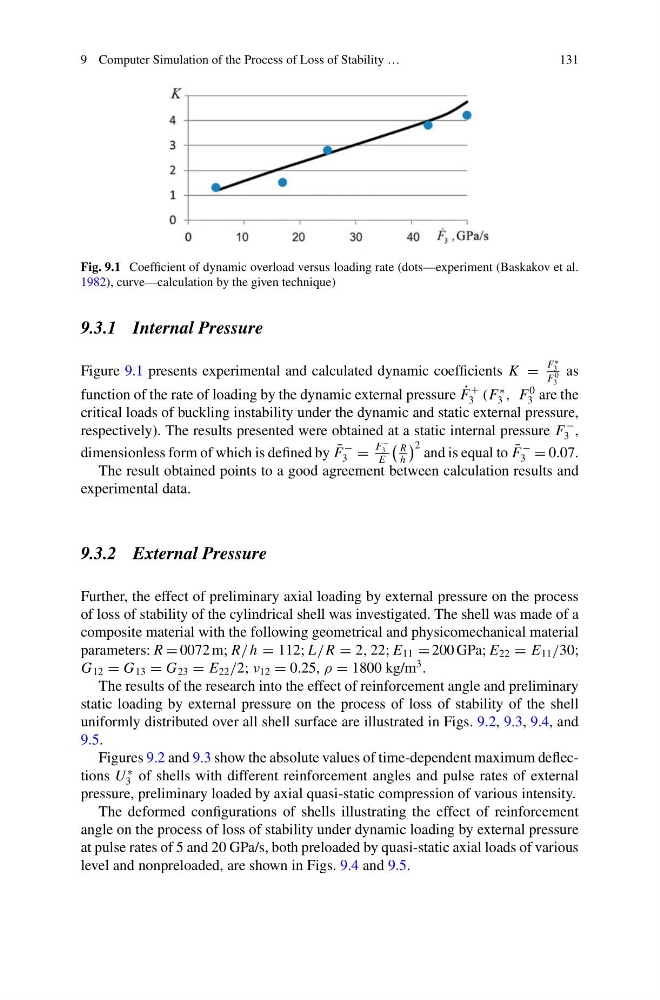
Fig. 9.1 Coefficient of dynamic overload versus loading rate (dots—experiment (Baskakov et al.
1982), curve—calculation by the given technique)
9.3.1 Internal Pressure
Figure 9.1 presents experimental and calculated dynamic coefficients K =
F
∗
3
F
0
3
as
function of the rate of loading by the dynamic external pressure ˙
F
+
3 (F
∗
3 , F
0
3 are the
critical loads of buckling instability under the dynamic and static external pressure,
respectively). The results presented were obtained at a static internal pressure F
−
3 ,
dimensionless form of which is defined by ¯
F
−
3 =
F
−
3
E
R
h
2 and is equal to ¯
F
−
3 = 0.07.
The result obtained points to a good agreement between calculation results and
experimental data.
9.3.2 External Pressure
Further, the effect of preliminary axial loading by external pressure on the process
of loss of stability of the cylindrical shell was investigated. The shell was made of a
composite material with the following geometrical and physicomechanical material
parameters: R = 0072 m; R/ h = 112; L/R = 2, 22; E 11 = 200 GPa; E 22 = E 11 /30;
G 12 = G 13 = G 23 = E 22 /2; ν 12 = 0.25, ρ = 1800 kg/m
3 .
The results of the research into the effect of reinforcement angle and preliminary
static loading by external pressure on the process of loss of stability of the shell
uniformly distributed over all shell surface are illustrated in Figs. 9.2, 9.3, 9.4, and
9.5.
Figures 9.2 and 9.3 show the absolute values of time-dependent maximum deflections U
∗
3 of shells with different reinforcement angles and pulse rates of external
pressure, preliminary loaded by axial quasi-static compression of various intensity.
The deformed configurations of shells illustrating the effect of reinforcement
angle on the process of loss of stability under dynamic loading by external pressure
at pulse rates of 5 and 20 GPa/s, both preloaded by quasi-static axial loads of various
level and nonpreloaded, are shown in Figs. 9.4 and 9.5.
131
Fig. 9.1 Coefficient of dynamic overload versus loading rate (dots—experiment (Baskakov et al.
1982), curve—calculation by the given technique)
9.3.1 Internal Pressure
Figure 9.1 presents experimental and calculated dynamic coefficients K =
F
∗
3
F
0
3
as
function of the rate of loading by the dynamic external pressure ˙
F
+
3 (F
∗
3 , F
0
3 are the
critical loads of buckling instability under the dynamic and static external pressure,
respectively). The results presented were obtained at a static internal pressure F
−
3 ,
dimensionless form of which is defined by ¯
F
−
3 =
F
−
3
E
R
h
2 and is equal to ¯
F
−
3 = 0.07.
The result obtained points to a good agreement between calculation results and
experimental data.
9.3.2 External Pressure
Further, the effect of preliminary axial loading by external pressure on the process
of loss of stability of the cylindrical shell was investigated. The shell was made of a
composite material with the following geometrical and physicomechanical material
parameters: R = 0072 m; R/ h = 112; L/R = 2, 22; E 11 = 200 GPa; E 22 = E 11 /30;
G 12 = G 13 = G 23 = E 22 /2; ν 12 = 0.25, ρ = 1800 kg/m
3 .
The results of the research into the effect of reinforcement angle and preliminary
static loading by external pressure on the process of loss of stability of the shell
uniformly distributed over all shell surface are illustrated in Figs. 9.2, 9.3, 9.4, and
9.5.
Figures 9.2 and 9.3 show the absolute values of time-dependent maximum deflections U
∗
3 of shells with different reinforcement angles and pulse rates of external
pressure, preliminary loaded by axial quasi-static compression of various intensity.
The deformed configurations of shells illustrating the effect of reinforcement
angle on the process of loss of stability under dynamic loading by external pressure
at pulse rates of 5 and 20 GPa/s, both preloaded by quasi-static axial loads of various
level and nonpreloaded, are shown in Figs. 9.4 and 9.5.