

161
in the hierarchical manner. Each record contains property data for
a material, each property stored as a range spanning its typical (or,
often, permitted) values. It also contains limited documentation in
the form of text, images, and references to sources of information
about the material. The data are interrogated by a search engine that
offers the search interfaces shown schematically in Figure 5.12. On
the left is a simple query interface for screening on single attributes.
The desired upper or lower limits for constrained properties are
entered; the search engine rejects all materials with attributes that
lie outside the limits. In the center is shown a second way of interrogating the data: a bar chart, constructed by the software, for any
numeric property in the database. It and the bubble chart shown
on the right are ways of both applying constraints and ranking. For
screening, a selection line or box is superimposed on the charts,
with edges that lie at the constrained values of the property (bar
chart) or properties (bubble chart). This eliminates the materials in
the shaded areas and retains the materials that meet the constraints.
If, instead, ranking is sought (having already applied all necessary
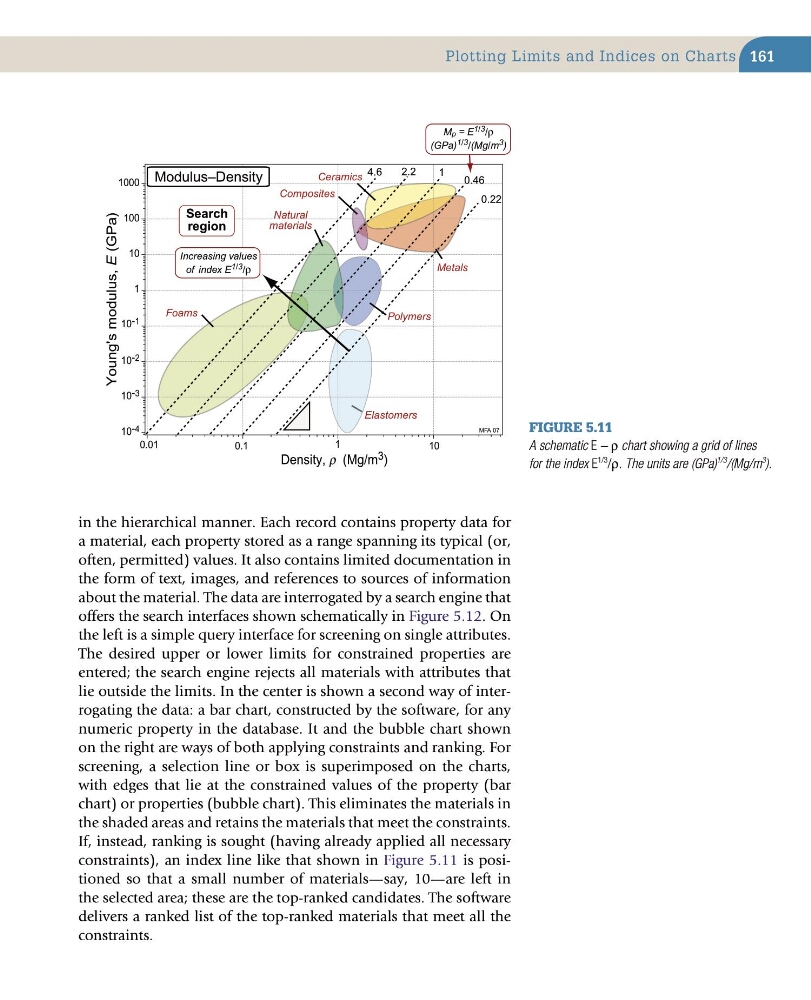
constraints), an index line like that shown in Figure 5.11 is positioned so that a small number of materials—say, 10—are left in
the selected area; these are the top-ranked candidates. The software
delivers a ranked list of the top-ranked materials that meet all the
constraints.
Figure 5.11
A schematic E − ρ chart showing a grid of lines
for the index E
1/3
/ρ. The units are (GPa)
1/3
/(Mg/m
3
).
Density, r (Mg/m 3 )
Young's modulus, E (GPa)
0.01
0.1
1
10
10 -4
10 -3
10 -2
10 -1
1
10
100
1000
Metals
Polymers
Natural
materials
Composites
Foams
Ceramics
Elastomers
Modulus–Density
Mp = E 1/3 /ρ
(GPa) 1/3 /(Mg/m 3 )
Increasing values
of index E 1/3 /ρ
Search
region
4.6
1
0.46
MFA 07
2.2
0.22
3
Plotting Limits and Indices on Charts
in the hierarchical manner. Each record contains property data for
a material, each property stored as a range spanning its typical (or,
often, permitted) values. It also contains limited documentation in
the form of text, images, and references to sources of information
about the material. The data are interrogated by a search engine that
offers the search interfaces shown schematically in Figure 5.12. On
the left is a simple query interface for screening on single attributes.
The desired upper or lower limits for constrained properties are
entered; the search engine rejects all materials with attributes that
lie outside the limits. In the center is shown a second way of interrogating the data: a bar chart, constructed by the software, for any
numeric property in the database. It and the bubble chart shown
on the right are ways of both applying constraints and ranking. For
screening, a selection line or box is superimposed on the charts,
with edges that lie at the constrained values of the property (bar
chart) or properties (bubble chart). This eliminates the materials in
the shaded areas and retains the materials that meet the constraints.
If, instead, ranking is sought (having already applied all necessary
constraints), an index line like that shown in Figure 5.11 is positioned so that a small number of materials—say, 10—are left in
the selected area; these are the top-ranked candidates. The software
delivers a ranked list of the top-ranked materials that meet all the
constraints.
Figure 5.11
A schematic E − ρ chart showing a grid of lines
for the index E
1/3
/ρ. The units are (GPa)
1/3
/(Mg/m
3
).
Density, r (Mg/m 3 )
Young's modulus, E (GPa)
0.01
0.1
1
10
10 -4
10 -3
10 -2
10 -1
1
10
100
1000
Metals
Polymers
Natural
materials
Composites
Foams
Ceramics
Elastomers
Modulus–Density
Mp = E 1/3 /ρ
(GPa) 1/3 /(Mg/m 3 )
Increasing values
of index E 1/3 /ρ
Search
region
4.6
1
0.46
MFA 07
2.2
0.22
3
Plotting Limits and Indices on Charts