

C haPter 5 Material Property Charts and their Uses
160
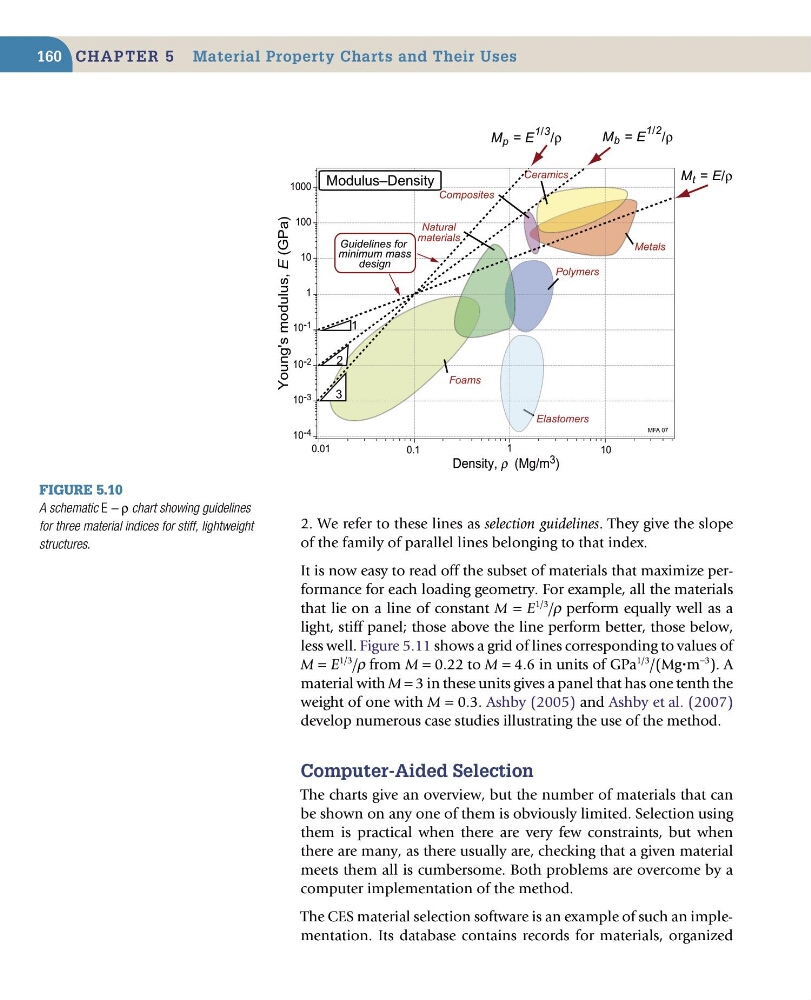
2. We refer to these lines as selection guidelines. They give the slope
of the family of parallel lines belonging to that index.
It is now easy to read off the subset of materials that maximize performance for each loading geometry. For example, all the materials
that lie on a line of constant M = E
1/3
/ρ perform equally well as a
light, stiff panel; those above the line perform better, those below,
less well. Figure 5.11 shows a grid of lines corresponding to values of
M = E
1/3
/ρ from M = 0.22 to M = 4.6 in units of GPa
1/3
/(Mgm
−3
). A
material with M = 3 in these units gives a panel that has one tenth the
weight of one with M = 0.3. Ashby (2005) and Ashby et al. (2007)
develop numerous case studies illustrating the use of the method.
Computer-aided selection
The charts give an overview, but the number of materials that can
be shown on any one of them is obviously limited. Selection using
them is practical when there are very few constraints, but when
there are many, as there usually are, checking that a given material
meets them all is cumbersome. Both problems are overcome by a
computer implementation of the method.
The CES material selection software is an example of such an implementation. Its database contains records for materials, organized
Figure 5.10
A schematic E − ρ chart showing guidelines
for three material indices for stiff, lightweight
structures.
Density, r (Mg/m 3 )
Young's modulus, E (GPa)
0.01
0.1
1
10
10 -4
10 -3
10 -2
10 -1
1
10
100
1000
Metals
Polymers
Natural
materials
Composites
Foams
Ceramics
Elastomers
Modulus–Density
MFA 07
M b = E
1/2 /ρ
M t = E/ρ
Guidelines for
minimum mass
design
1
2
3
M p = E
1/3 /ρ
160
2. We refer to these lines as selection guidelines. They give the slope
of the family of parallel lines belonging to that index.
It is now easy to read off the subset of materials that maximize performance for each loading geometry. For example, all the materials
that lie on a line of constant M = E
1/3
/ρ perform equally well as a
light, stiff panel; those above the line perform better, those below,
less well. Figure 5.11 shows a grid of lines corresponding to values of
M = E
1/3
/ρ from M = 0.22 to M = 4.6 in units of GPa
1/3
/(Mgm
−3
). A
material with M = 3 in these units gives a panel that has one tenth the
weight of one with M = 0.3. Ashby (2005) and Ashby et al. (2007)
develop numerous case studies illustrating the use of the method.
Computer-aided selection
The charts give an overview, but the number of materials that can
be shown on any one of them is obviously limited. Selection using
them is practical when there are very few constraints, but when
there are many, as there usually are, checking that a given material
meets them all is cumbersome. Both problems are overcome by a
computer implementation of the method.
The CES material selection software is an example of such an implementation. Its database contains records for materials, organized
Figure 5.10
A schematic E − ρ chart showing guidelines
for three material indices for stiff, lightweight
structures.
Density, r (Mg/m 3 )
Young's modulus, E (GPa)
0.01
0.1
1
10
10 -4
10 -3
10 -2
10 -1
1
10
100
1000
Metals
Polymers
Natural
materials
Composites
Foams
Ceramics
Elastomers
Modulus–Density
MFA 07
M b = E
1/2 /ρ
M t = E/ρ
Guidelines for
minimum mass
design
1
2
3
M p = E
1/3 /ρ