

151
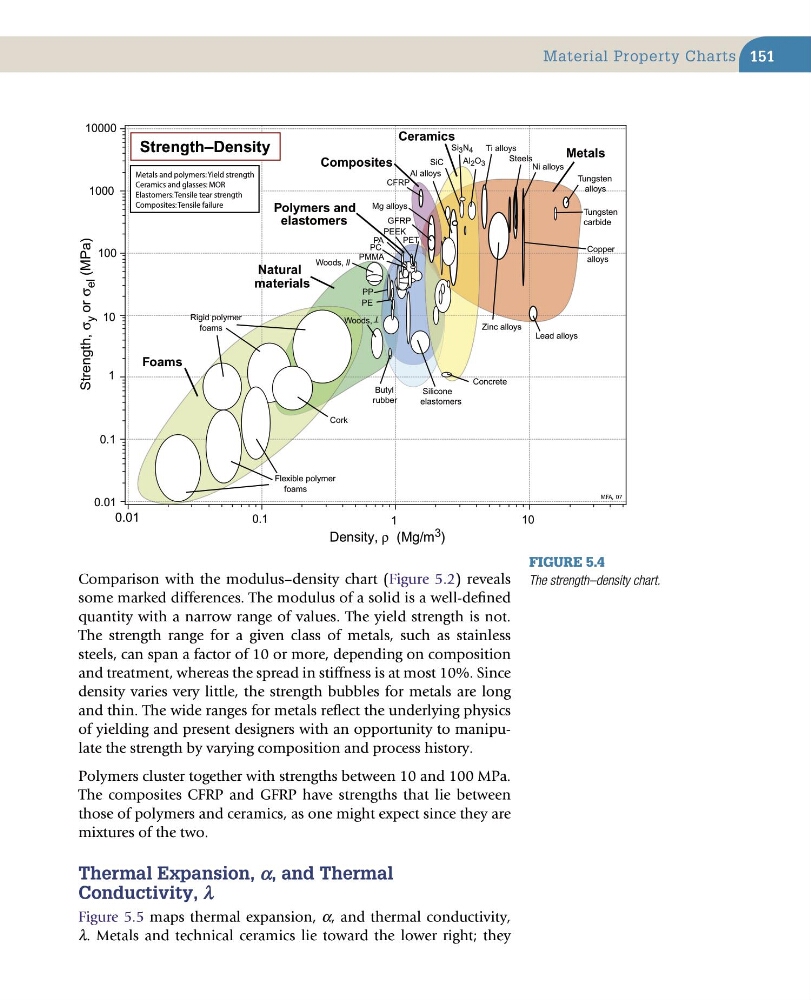
Comparison with the modulus–density chart (Figure 5.2) reveals
some marked differences. The modulus of a solid is a well-defined
quantity with a narrow range of values. The yield strength is not.
The strength range for a given class of metals, such as stainless
steels, can span a factor of 10 or more, depending on composition
and treatment, whereas the spread in stiffness is at most 10%. Since
density varies very little, the strength bubbles for metals are long
and thin. The wide ranges for metals reflect the underlying physics
of yielding and present designers with an opportunity to manipulate the strength by varying composition and process history.
Polymers cluster together with strengths between 10 and 100 MPa.
The composites CFRP and GFRP have strengths that lie between
those of polymers and ceramics, as one might expect since they are
mixtures of the two.
thermal expansion, α, and thermal
Conductivity, λ
Figure 5.5 maps thermal expansion, α, and thermal conductivity,
λ. Metals and technical ceramics lie toward the lower right; they
Figure 5.4
The strength–density chart.
Density, ρ (Mg/m 3 )
0.01
Strength,
σ
y or
σ
el (MPa)
0.01
10
0.1
1
0.1
1
10
100
1000
10000
PP
PE
Woods,
T
Foams
Polymers and
elastomers
Metals
Ceramics
Composites
Natural
materials
Lead alloys
Tungsten
alloys
Steels
Ti alloys
Mg alloys
CFRP
GFRP
Al alloys
Rigid polymer
foams
Flexible polymer
foams
Ni alloys
Copper
alloys
Zinc alloys
PA
PEEK
PMMA
PC
PET
Cork
Woods, ll
Butyl
rubber
Silicone
elastomers
Concrete
Tungsten
carbide
Al 2 O 3
SiC
Si 3 N 4
Strength–Density
MFA, 07
Metals and polymers: Yield strength
Ceramics and glasses: MOR
Elastomers: Tensile tear strength
Composites: Tensile failure
Material Property Charts
Comparison with the modulus–density chart (Figure 5.2) reveals
some marked differences. The modulus of a solid is a well-defined
quantity with a narrow range of values. The yield strength is not.
The strength range for a given class of metals, such as stainless
steels, can span a factor of 10 or more, depending on composition
and treatment, whereas the spread in stiffness is at most 10%. Since
density varies very little, the strength bubbles for metals are long
and thin. The wide ranges for metals reflect the underlying physics
of yielding and present designers with an opportunity to manipulate the strength by varying composition and process history.
Polymers cluster together with strengths between 10 and 100 MPa.
The composites CFRP and GFRP have strengths that lie between
those of polymers and ceramics, as one might expect since they are
mixtures of the two.
thermal expansion, α, and thermal
Conductivity, λ
Figure 5.5 maps thermal expansion, α, and thermal conductivity,
λ. Metals and technical ceramics lie toward the lower right; they
Figure 5.4
The strength–density chart.
Density, ρ (Mg/m 3 )
0.01
Strength,
σ
y or
σ
el (MPa)
0.01
10
0.1
1
0.1
1
10
100
1000
10000
PP
PE
Woods,
T
Foams
Polymers and
elastomers
Metals
Ceramics
Composites
Natural
materials
Lead alloys
Tungsten
alloys
Steels
Ti alloys
Mg alloys
CFRP
GFRP
Al alloys
Rigid polymer
foams
Flexible polymer
foams
Ni alloys
Copper
alloys
Zinc alloys
PA
PEEK
PMMA
PC
PET
Cork
Woods, ll
Butyl
rubber
Silicone
elastomers
Concrete
Tungsten
carbide
Al 2 O 3
SiC
Si 3 N 4
Strength–Density
MFA, 07
Metals and polymers: Yield strength
Ceramics and glasses: MOR
Elastomers: Tensile tear strength
Composites: Tensile failure
Material Property Charts