

C haPter 5 Material Property Charts and their Uses
150
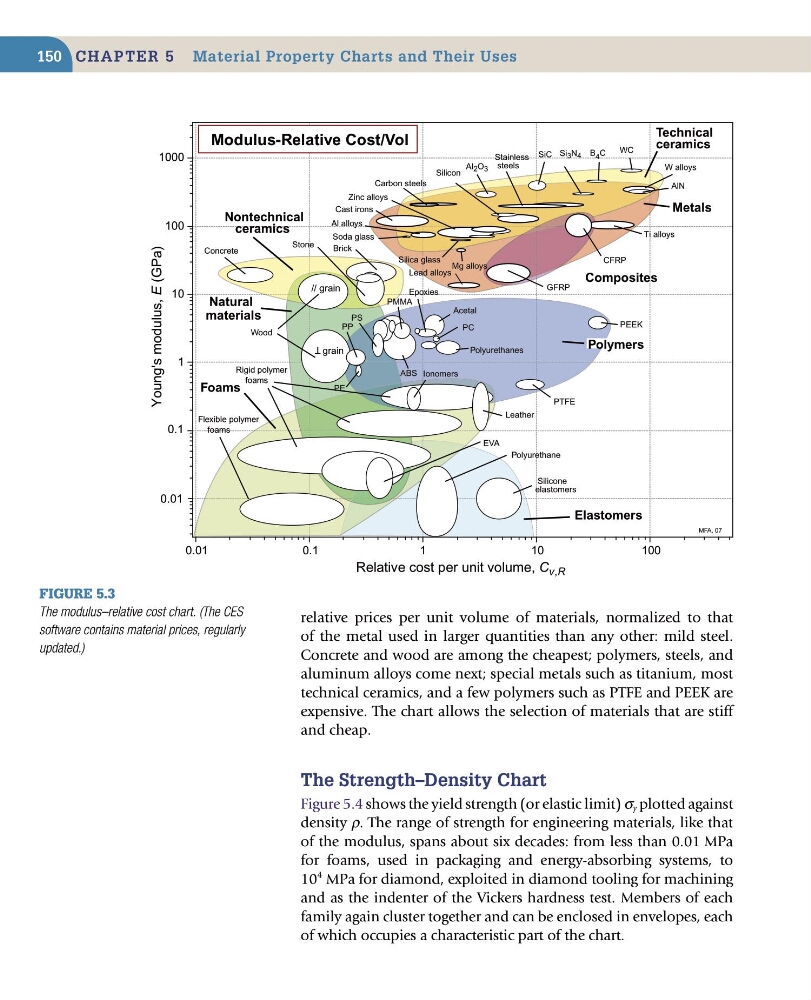
relative prices per unit volume of materials, normalized to that
of the metal used in larger quantities than any other: mild steel.
Concrete and wood are among the cheapest; polymers, steels, and
aluminum alloys come next; special metals such as titanium, most
technical ceramics, and a few polymers such as PTFE and PEEK are
expensive. The chart allows the selection of materials that are stiff
and cheap.
the strength–Density Chart
Figure 5.4 shows the yield strength (or elastic limit) σ y plotted against
density ρ. The range of strength for engineering materials, like that
of the modulus, spans about six decades: from less than 0.01 MPa
for foams, used in packaging and energy-absorbing systems, to
10
4 MPa for diamond, exploited in diamond tooling for machining
and as the indenter of the Vickers hardness test. Members of each
family again cluster together and can be enclosed in envelopes, each
of which occupies a characteristic part of the chart.
Figure 5.3
The modulus–relative cost chart. (The CES
software contains material prices, regularly
updated.)
Relative cost per unit volume, C v,R
Young's modulus, E (GPa)
0.01
0.1
1
10
100
0.01
0.1
1
10
100
1000
Foams
Polymers
Metals
Technical
ceramics
Composites
Natural
materials
Lead alloys
W alloys
Carbon steels
Ti alloys
Mg alloys
CFRP
GFRP
Al alloys
Rigid polymer
foams
Flexible polymer
foams
Zinc alloys
PS
PTFE
PC
Wood
Silicone
elastomers
Concrete
Al 2 O 3
SiC Si 3 N 4
Modulus-Relative Cost/Vol
B 4 C
PP
EVA
Polyurethane
Leather
Nontechnical
ceramics
MFA, 07
Cast irons
WC
Soda glass
Silica glass
Silicon
Stone
Brick
ABS
Epoxies
Ionomers
AlN
Stainless
steels
PEEK
PE
PMMA
Polyurethanes
Acetal
// grain
grain
T
Elastomers
150
relative prices per unit volume of materials, normalized to that
of the metal used in larger quantities than any other: mild steel.
Concrete and wood are among the cheapest; polymers, steels, and
aluminum alloys come next; special metals such as titanium, most
technical ceramics, and a few polymers such as PTFE and PEEK are
expensive. The chart allows the selection of materials that are stiff
and cheap.
the strength–Density Chart
Figure 5.4 shows the yield strength (or elastic limit) σ y plotted against
density ρ. The range of strength for engineering materials, like that
of the modulus, spans about six decades: from less than 0.01 MPa
for foams, used in packaging and energy-absorbing systems, to
10
4 MPa for diamond, exploited in diamond tooling for machining
and as the indenter of the Vickers hardness test. Members of each
family again cluster together and can be enclosed in envelopes, each
of which occupies a characteristic part of the chart.
Figure 5.3
The modulus–relative cost chart. (The CES
software contains material prices, regularly
updated.)
Relative cost per unit volume, C v,R
Young's modulus, E (GPa)
0.01
0.1
1
10
100
0.01
0.1
1
10
100
1000
Foams
Polymers
Metals
Technical
ceramics
Composites
Natural
materials
Lead alloys
W alloys
Carbon steels
Ti alloys
Mg alloys
CFRP
GFRP
Al alloys
Rigid polymer
foams
Flexible polymer
foams
Zinc alloys
PS
PTFE
PC
Wood
Silicone
elastomers
Concrete
Al 2 O 3
SiC Si 3 N 4
Modulus-Relative Cost/Vol
B 4 C
PP
EVA
Polyurethane
Leather
Nontechnical
ceramics
MFA, 07
Cast irons
WC
Soda glass
Silica glass
Silicon
Stone
Brick
ABS
Epoxies
Ionomers
AlN
Stainless
steels
PEEK
PE
PMMA
Polyurethanes
Acetal
// grain
grain
T
Elastomers