

149
■ They become a tool for optimized selection of materials to
meet given design requirements, and they help us understand
the use of materials in existing products.
■ They allow the properties of new materials, such as those with
nano or amorphous structures, to be displayed and compared
with those of conventional materials, bringing out their novel
characteristics and suggesting possible applications.
To introduce the charts a little further, we briefly describe five more:
the modulus–relative cost chart, the strength–density chart, the
thermal expansion/thermal conductivity chart, and two that relate
to the tactile and the acoustic properties of materials. Fuller descriptions of a wider range of charts can be found in Ashby (2005) and
Ashby et al. (2007).
the Modulus–relative Cost Chart
Often it is minimizing cost, not weight, that is the overriding
objective of a design. The chart of Figure 5.3 shows, on the x axis, the
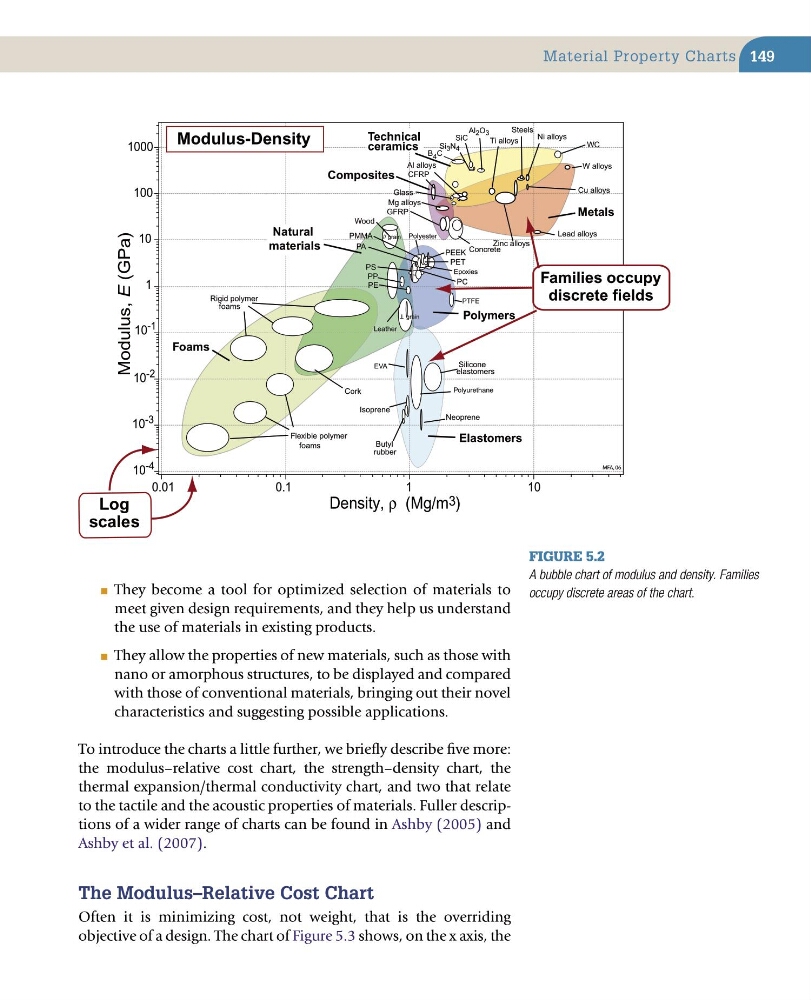
Figure 5.2
A bubble chart of modulus and density. Families
occupy discrete areas of the chart.
Density, ρ (Mg/m 3 )
0.01
Modulus, E (GPa)
10 -4
0.1
1
10
10 -3
10 -2
10 -1
1
10
100
1000
Polyester
Foams
Polymers
Metals
Technical
ceramics
Composites
Lead alloys
W alloys
Steels
Ti alloys
Mg alloys
CFRP
GFRP
Al alloys
Rigid polymer
foams
Flexible polymer
foams
Ni alloys
Cu alloys
Zinc alloys
PA
PEEK
PMMA
PC
PET
Cork
Wood
Butyl
rubber
Silicone
elastomers
Concrete
WC
Al 2 O 3
SiC
Si 3 N 4
Modulus-Density
B 4 C
Epoxies
PS
PTFE
EVA
Neoprene
Isoprene
Polyurethane
Leather
MFA, 06
PP
PE
Glass
// grain
grain
T
Elastomers
Natural
materials
Families occupy
discrete fields
Log
scales
Material Property Charts
■ They become a tool for optimized selection of materials to
meet given design requirements, and they help us understand
the use of materials in existing products.
■ They allow the properties of new materials, such as those with
nano or amorphous structures, to be displayed and compared
with those of conventional materials, bringing out their novel
characteristics and suggesting possible applications.
To introduce the charts a little further, we briefly describe five more:
the modulus–relative cost chart, the strength–density chart, the
thermal expansion/thermal conductivity chart, and two that relate
to the tactile and the acoustic properties of materials. Fuller descriptions of a wider range of charts can be found in Ashby (2005) and
Ashby et al. (2007).
the Modulus–relative Cost Chart
Often it is minimizing cost, not weight, that is the overriding
objective of a design. The chart of Figure 5.3 shows, on the x axis, the
Figure 5.2
A bubble chart of modulus and density. Families
occupy discrete areas of the chart.
Density, ρ (Mg/m 3 )
0.01
Modulus, E (GPa)
10 -4
0.1
1
10
10 -3
10 -2
10 -1
1
10
100
1000
Polyester
Foams
Polymers
Metals
Technical
ceramics
Composites
Lead alloys
W alloys
Steels
Ti alloys
Mg alloys
CFRP
GFRP
Al alloys
Rigid polymer
foams
Flexible polymer
foams
Ni alloys
Cu alloys
Zinc alloys
PA
PEEK
PMMA
PC
PET
Cork
Wood
Butyl
rubber
Silicone
elastomers
Concrete
WC
Al 2 O 3
SiC
Si 3 N 4
Modulus-Density
B 4 C
Epoxies
PS
PTFE
EVA
Neoprene
Isoprene
Polyurethane
Leather
MFA, 06
PP
PE
Glass
// grain
grain
T
Elastomers
Natural
materials
Families occupy
discrete fields
Log
scales
Material Property Charts