

C hapter 4 Material Classes, structure, and properties
110
σ ideal
E
≈
1
10
(4.15)
This doesn’t allow for the curvature of the force-distance curve;
more refined calculations give a ratio of 1/15.
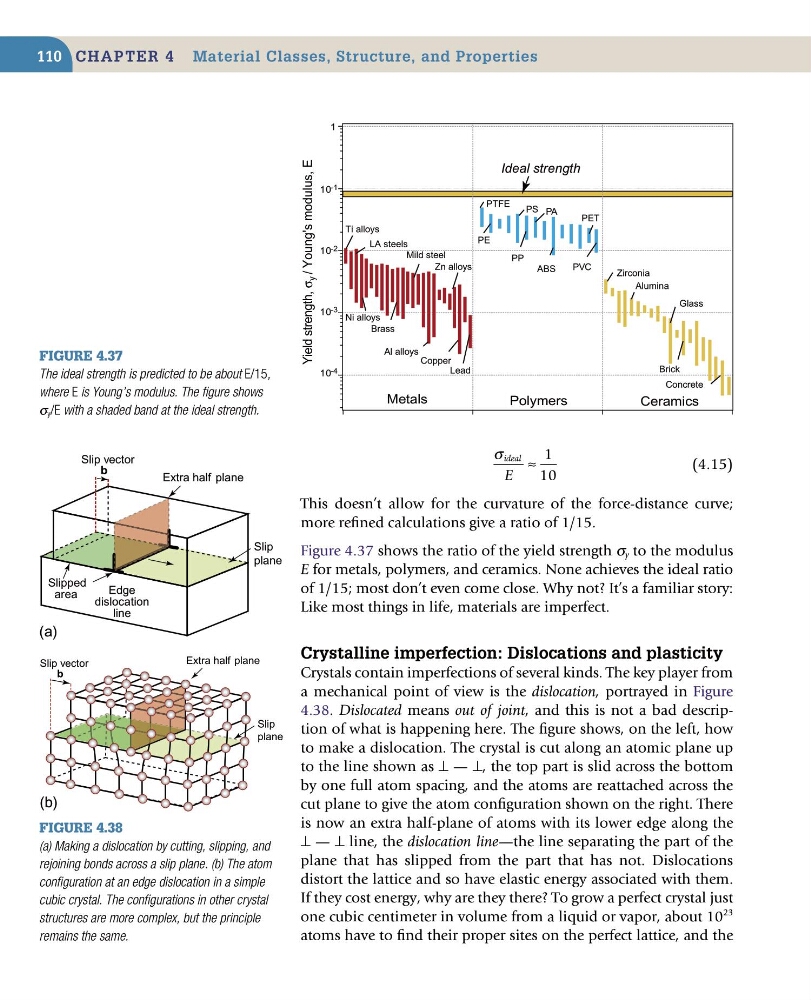
Figure 4.37 shows the ratio of the yield strength σ y to the modulus
E for metals, polymers, and ceramics. None achieves the ideal ratio
of 1/15; most don’t even come close. Why not? It’s a familiar story:
Like most things in life, materials are imperfect.
Crystalline imperfection: Dislocations and plasticity
Crystals contain imperfections of several kinds. The key player from
a mechanical point of view is the dislocation, portrayed in Figure
4.38. Dislocated means out of joint, and this is not a bad description of what is happening here. The figure shows, on the left, how
to make a dislocation. The crystal is cut along an atomic plane up
to the line shown as ⊥ — ⊥, the top part is slid across the bottom
by one full atom spacing, and the atoms are reattached across the
cut plane to give the atom configuration shown on the right. There
is now an extra half-plane of atoms with its lower edge along the
⊥ — ⊥ line, the dislocation line—the line separating the part of the
plane that has slipped from the part that has not. Dislocations
distort the lattice and so have elastic energy associated with them.
If they cost energy, why are they there? To grow a perfect crystal just
one cubic centimeter in volume from a liquid or vapor, about 10
23
atoms have to find their proper sites on the perfect lattice, and the
Figure 4.37
The ideal strength is predicted to be about E/15,
where E is Young’s modulus. The figure shows
σ y /E with a shaded band at the ideal strength.
Metals
Polymers
Ceramics
Yield strength,
σ
y / Young's modulus, E
10 -4
10 -3
1
10 -2
10 -1
Ideal strength
PTFE
PE
PP
PS
PVC
PET
ABS
PA
Ti alloys
Lead
Copper
Al alloys
Zn alloys
Ni alloys
Mild steel
Brass
Glass
Zirconia
Alumina
Concrete
Brick
LA steels
Figure 4.38
(a) Making a dislocation by cutting, slipping, and
rejoining bonds across a slip plane. (b) The atom
configuration at an edge dislocation in a simple
cubic crystal. The configurations in other crystal
structures are more complex, but the principle
remains the same.
Extra half plane
Edge
dislocation
line
Slipped
area
b
Slip vector
(a)
Slip
plane
Extra half plane
b
Slip vector
(b)
Slip
plane
110
σ ideal
E
≈
1
10
(4.15)
This doesn’t allow for the curvature of the force-distance curve;
more refined calculations give a ratio of 1/15.
Figure 4.37 shows the ratio of the yield strength σ y to the modulus
E for metals, polymers, and ceramics. None achieves the ideal ratio
of 1/15; most don’t even come close. Why not? It’s a familiar story:
Like most things in life, materials are imperfect.
Crystalline imperfection: Dislocations and plasticity
Crystals contain imperfections of several kinds. The key player from
a mechanical point of view is the dislocation, portrayed in Figure
4.38. Dislocated means out of joint, and this is not a bad description of what is happening here. The figure shows, on the left, how
to make a dislocation. The crystal is cut along an atomic plane up
to the line shown as ⊥ — ⊥, the top part is slid across the bottom
by one full atom spacing, and the atoms are reattached across the
cut plane to give the atom configuration shown on the right. There
is now an extra half-plane of atoms with its lower edge along the
⊥ — ⊥ line, the dislocation line—the line separating the part of the
plane that has slipped from the part that has not. Dislocations
distort the lattice and so have elastic energy associated with them.
If they cost energy, why are they there? To grow a perfect crystal just
one cubic centimeter in volume from a liquid or vapor, about 10
23
atoms have to find their proper sites on the perfect lattice, and the
Figure 4.37
The ideal strength is predicted to be about E/15,
where E is Young’s modulus. The figure shows
σ y /E with a shaded band at the ideal strength.
Metals
Polymers
Ceramics
Yield strength,
σ
y / Young's modulus, E
10 -4
10 -3
1
10 -2
10 -1
Ideal strength
PTFE
PE
PP
PS
PVC
PET
ABS
PA
Ti alloys
Lead
Copper
Al alloys
Zn alloys
Ni alloys
Mild steel
Brass
Glass
Zirconia
Alumina
Concrete
Brick
LA steels
Figure 4.38
(a) Making a dislocation by cutting, slipping, and
rejoining bonds across a slip plane. (b) The atom
configuration at an edge dislocation in a simple
cubic crystal. The configurations in other crystal
structures are more complex, but the principle
remains the same.
Extra half plane
Edge
dislocation
line
Slipped
area
b
Slip vector
(a)
Slip
plane
Extra half plane
b
Slip vector
(b)
Slip
plane