

107
Mechanical Behavior
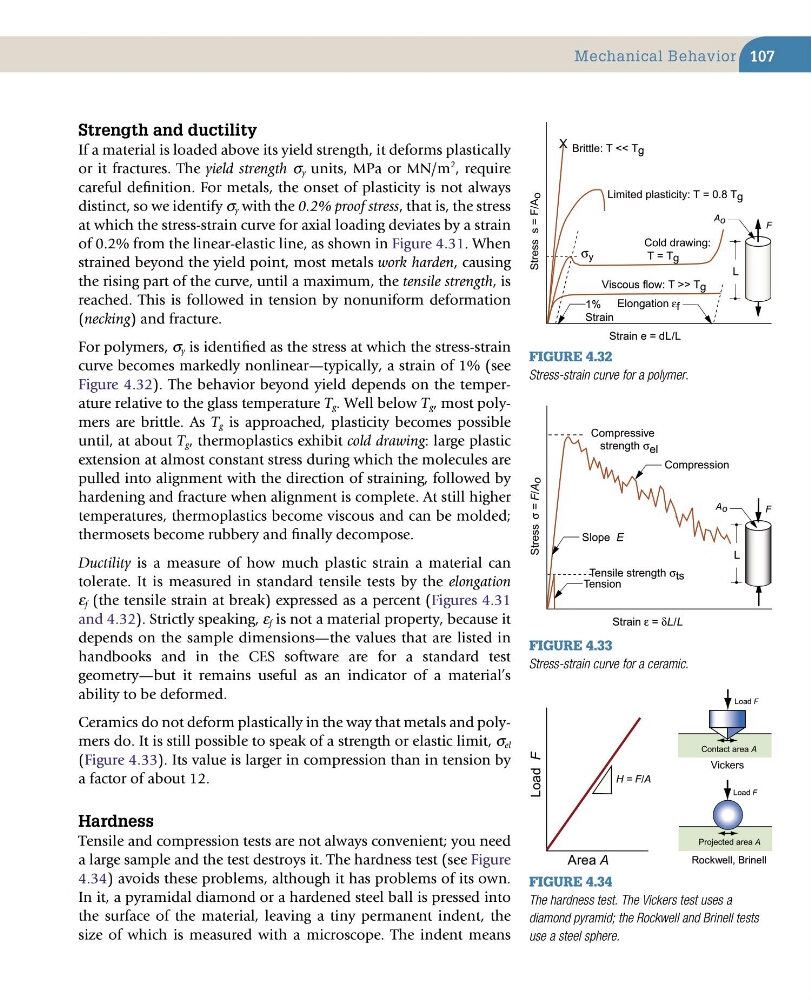
Figure 4.32
Stress-strain curve for a polymer.
X
Stress s = F/A
o
Strain e = dL/L
Brittle: T << T g
Limited plasticity: T = 0.8 T g
Cold drawing:
T = T g
Viscous flow: T >> T g
1%
Strain
F
A o
σ y
Elongation ε f
L
Figure 4.33
Stress-strain curve for a ceramic.
Stress
σ = F/A
o
Strain ε = δL/L
Slope E
Tension
Compression
F
Compressive
strength σ el
Tensile strength σ ts
A o
L
Figure 4.34
The hardness test. The Vickers test uses a
diamond pyramid; the Rockwell and Brinell tests
use a steel sphere.
Load F
Area A
H = F/A
Load F
Contact area A
Load F
Projected area A
Vickers
Rockwell, Brinell
strength and ductility
If a material is loaded above its yield strength, it deforms plastically
or it fractures. The yield strength σ y units, MPa or MN/m
2 , require
careful definition. For metals, the onset of plasticity is not always
distinct, so we identify σ y with the 0.2% proof stress, that is, the stress
at which the stress-strain curve for axial loading deviates by a strain
of 0.2% from the linear-elastic line, as shown in Figure 4.31. When
strained beyond the yield point, most metals work harden, causing
the rising part of the curve, until a maximum, the tensile strength, is
reached. This is followed in tension by nonuniform deformation
(necking) and fracture.
For polymers, σ y is identified as the stress at which the stress-strain
curve becomes markedly nonlinear—typically, a strain of 1% (see
Figure 4.32). The behavior beyond yield depends on the temperature relative to the glass temperature T g . Well below T g , most polymers are brittle. As T g is approached, plasticity becomes possible
until, at about T g , thermoplastics exhibit cold drawing: large plastic
extension at almost constant stress during which the molecules are
pulled into alignment with the direction of straining, followed by
hardening and fracture when alignment is complete. At still higher
temperatures, thermoplastics become viscous and can be molded;
thermosets become rubbery and finally decompose.
Ductility is a measure of how much plastic strain a material can
tolerate. It is measured in standard tensile tests by the elongation
ε f (the tensile strain at break) expressed as a percent (Figures 4.31
and 4.32). Strictly speaking, ε f is not a material property, because it
depends on the sample dimensions—the values that are listed in
handbooks and in the CES software are for a standard test
geometry—but it remains useful as an indicator of a material’s
ability to be deformed.
Ceramics do not deform plastically in the way that metals and polymers do. It is still possible to speak of a strength or elastic limit, σ el
(Figure 4.33). Its value is larger in compression than in tension by
a factor of about 12.
hardness
Tensile and compression tests are not always convenient; you need
a large sample and the test destroys it. The hardness test (see Figure
4.34) avoids these problems, although it has problems of its own.
In it, a pyramidal diamond or a hardened steel ball is pressed into
the surface of the material, leaving a tiny permanent indent, the
size of which is measured with a microscope. The indent means
Mechanical Behavior
Figure 4.32
Stress-strain curve for a polymer.
X
Stress s = F/A
o
Strain e = dL/L
Brittle: T << T g
Limited plasticity: T = 0.8 T g
Cold drawing:
T = T g
Viscous flow: T >> T g
1%
Strain
F
A o
σ y
Elongation ε f
L
Figure 4.33
Stress-strain curve for a ceramic.
Stress
σ = F/A
o
Strain ε = δL/L
Slope E
Tension
Compression
F
Compressive
strength σ el
Tensile strength σ ts
A o
L
Figure 4.34
The hardness test. The Vickers test uses a
diamond pyramid; the Rockwell and Brinell tests
use a steel sphere.
Load F
Area A
H = F/A
Load F
Contact area A
Load F
Projected area A
Vickers
Rockwell, Brinell
strength and ductility
If a material is loaded above its yield strength, it deforms plastically
or it fractures. The yield strength σ y units, MPa or MN/m
2 , require
careful definition. For metals, the onset of plasticity is not always
distinct, so we identify σ y with the 0.2% proof stress, that is, the stress
at which the stress-strain curve for axial loading deviates by a strain
of 0.2% from the linear-elastic line, as shown in Figure 4.31. When
strained beyond the yield point, most metals work harden, causing
the rising part of the curve, until a maximum, the tensile strength, is
reached. This is followed in tension by nonuniform deformation
(necking) and fracture.
For polymers, σ y is identified as the stress at which the stress-strain
curve becomes markedly nonlinear—typically, a strain of 1% (see
Figure 4.32). The behavior beyond yield depends on the temperature relative to the glass temperature T g . Well below T g , most polymers are brittle. As T g is approached, plasticity becomes possible
until, at about T g , thermoplastics exhibit cold drawing: large plastic
extension at almost constant stress during which the molecules are
pulled into alignment with the direction of straining, followed by
hardening and fracture when alignment is complete. At still higher
temperatures, thermoplastics become viscous and can be molded;
thermosets become rubbery and finally decompose.
Ductility is a measure of how much plastic strain a material can
tolerate. It is measured in standard tensile tests by the elongation
ε f (the tensile strain at break) expressed as a percent (Figures 4.31
and 4.32). Strictly speaking, ε f is not a material property, because it
depends on the sample dimensions—the values that are listed in
handbooks and in the CES software are for a standard test
geometry—but it remains useful as an indicator of a material’s
ability to be deformed.
Ceramics do not deform plastically in the way that metals and polymers do. It is still possible to speak of a strength or elastic limit, σ el
(Figure 4.33). Its value is larger in compression than in tension by
a factor of about 12.
hardness
Tensile and compression tests are not always convenient; you need
a large sample and the test destroys it. The hardness test (see Figure
4.34) avoids these problems, although it has problems of its own.
In it, a pyramidal diamond or a hardened steel ball is pressed into
the surface of the material, leaving a tiny permanent indent, the
size of which is measured with a microscope. The indent means