

5.3 Formation of Deposited Layers Made of Eroded Materials
85
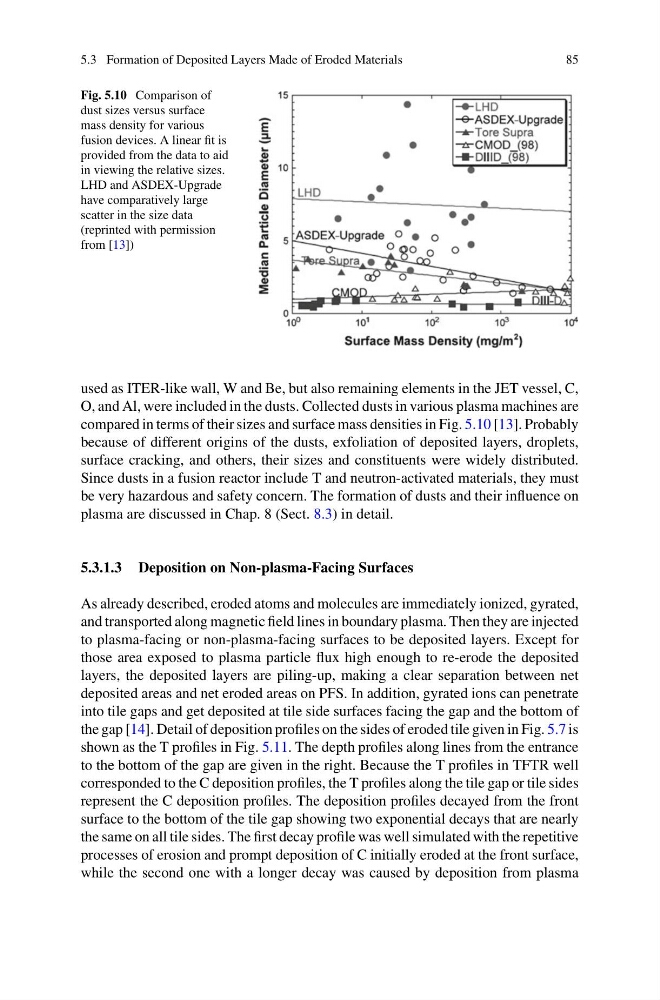
Fig. 5.10 Comparison of
dust sizes versus surface
mass density for various
fusion devices. A linear fit is
provided from the data to aid
in viewing the relative sizes.
LHD and ASDEX-Upgrade
have comparatively large
scatter in the size data
(reprinted with permission
from [13])
used as ITER-like wall, W and Be, but also remaining elements in the JET vessel, C,
O, and Al, were included in the dusts. Collected dusts in various plasma machines are
compared in terms of their sizes and surface mass densities in Fig. 5.10 [13]. Probably
because of different origins of the dusts, exfoliation of deposited layers, droplets,
surface cracking, and others, their sizes and constituents were widely distributed.
Since dusts in a fusion reactor include T and neutron-activated materials, they must
be very hazardous and safety concern. The formation of dusts and their influence on
plasma are discussed in Chap. 8 (Sect. 8.3) in detail.
5.3.1.3 Deposition on Non-plasma-Facing Surfaces
As already described, eroded atoms and molecules are immediately ionized, gyrated,
and transported along magnetic field lines in boundary plasma. Then they are injected
to plasma-facing or non-plasma-facing surfaces to be deposited layers. Except for
those area exposed to plasma particle flux high enough to re-erode the deposited
layers, the deposited layers are piling-up, making a clear separation between net
deposited areas and net eroded areas on PFS. In addition, gyrated ions can penetrate
into tile gaps and get deposited at tile side surfaces facing the gap and the bottom of
the gap [14]. Detail of deposition profiles on the sides of eroded tile given in Fig. 5.7 is
shown as the T profiles in Fig. 5.11. The depth profiles along lines from the entrance
to the bottom of the gap are given in the right. Because the T profiles in TFTR well
corresponded to the C deposition profiles, the T profiles along the tile gap or tile sides
represent the C deposition profiles. The deposition profiles decayed from the front
surface to the bottom of the tile gap showing two exponential decays that are nearly
the same on all tile sides. The first decay profile was well simulated with the repetitive
processes of erosion and prompt deposition of C initially eroded at the front surface,
while the second one with a longer decay was caused by deposition from plasma
85
Fig. 5.10 Comparison of
dust sizes versus surface
mass density for various
fusion devices. A linear fit is
provided from the data to aid
in viewing the relative sizes.
LHD and ASDEX-Upgrade
have comparatively large
scatter in the size data
(reprinted with permission
from [13])
used as ITER-like wall, W and Be, but also remaining elements in the JET vessel, C,
O, and Al, were included in the dusts. Collected dusts in various plasma machines are
compared in terms of their sizes and surface mass densities in Fig. 5.10 [13]. Probably
because of different origins of the dusts, exfoliation of deposited layers, droplets,
surface cracking, and others, their sizes and constituents were widely distributed.
Since dusts in a fusion reactor include T and neutron-activated materials, they must
be very hazardous and safety concern. The formation of dusts and their influence on
plasma are discussed in Chap. 8 (Sect. 8.3) in detail.
5.3.1.3 Deposition on Non-plasma-Facing Surfaces
As already described, eroded atoms and molecules are immediately ionized, gyrated,
and transported along magnetic field lines in boundary plasma. Then they are injected
to plasma-facing or non-plasma-facing surfaces to be deposited layers. Except for
those area exposed to plasma particle flux high enough to re-erode the deposited
layers, the deposited layers are piling-up, making a clear separation between net
deposited areas and net eroded areas on PFS. In addition, gyrated ions can penetrate
into tile gaps and get deposited at tile side surfaces facing the gap and the bottom of
the gap [14]. Detail of deposition profiles on the sides of eroded tile given in Fig. 5.7 is
shown as the T profiles in Fig. 5.11. The depth profiles along lines from the entrance
to the bottom of the gap are given in the right. Because the T profiles in TFTR well
corresponded to the C deposition profiles, the T profiles along the tile gap or tile sides
represent the C deposition profiles. The deposition profiles decayed from the front
surface to the bottom of the tile gap showing two exponential decays that are nearly
the same on all tile sides. The first decay profile was well simulated with the repetitive
processes of erosion and prompt deposition of C initially eroded at the front surface,
while the second one with a longer decay was caused by deposition from plasma