

86
5 Erosion and Deposition and Their Influence on Plasma …
PSL intensity [Arb.Unit]
x: Distance from front [mm]
0
10
20
30
0
10
20
30 0
10
20
30
10 3
10 2
10 1
10 0
10 3
10 2
10 1
10 0
0
10
20
30
(a) Upside
(b) Bottom side
(d) Right side
(c) Left side
Tile:KC2
(a)
(b)
(c)
(d)
)
exp(
)
exp(
)
(
2
2
1
1
x
C
x
C
x
PSL
−
+
−
=
x: Distance from front
λ 1 : Short-term decay length
λ 2 : Long-term decay length
KC2
(a)
(b)
(c)
(d)
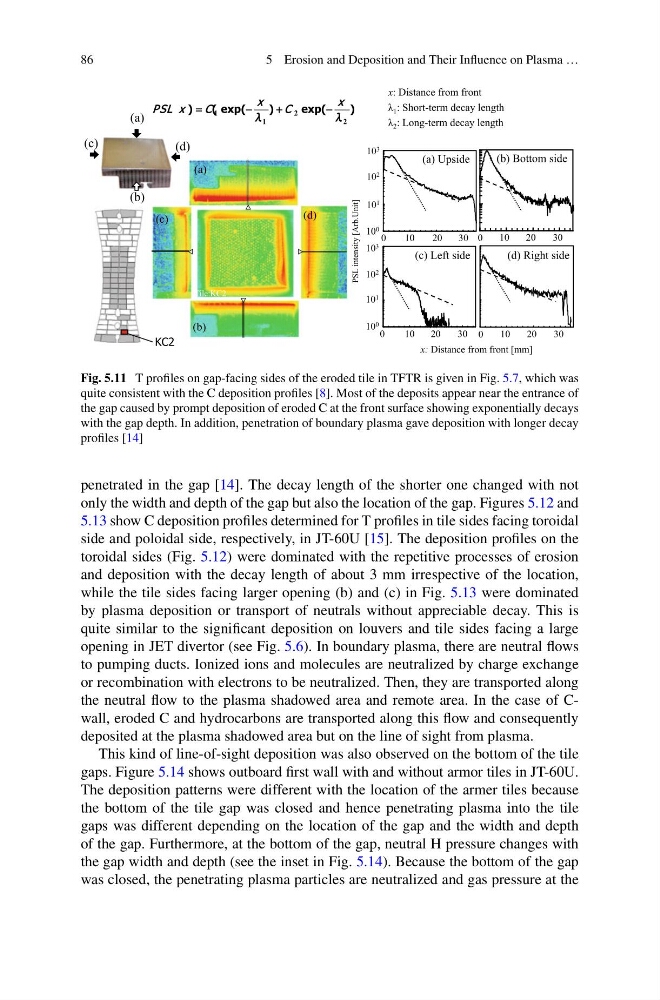
Fig. 5.11 T profiles on gap-facing sides of the eroded tile in TFTR is given in Fig. 5.7, which was
quite consistent with the C deposition profiles [8]. Most of the deposits appear near the entrance of
the gap caused by prompt deposition of eroded C at the front surface showing exponentially decays
with the gap depth. In addition, penetration of boundary plasma gave deposition with longer decay
profiles [14]
penetrated in the gap [14]. The decay length of the shorter one changed with not
only the width and depth of the gap but also the location of the gap. Figures 5.12 and
5.13 show C deposition profiles determined for T profiles in tile sides facing toroidal
side and poloidal side, respectively, in JT-60U [15]. The deposition profiles on the
toroidal sides (Fig. 5.12) were dominated with the repetitive processes of erosion
and deposition with the decay length of about 3 mm irrespective of the location,
while the tile sides facing larger opening (b) and (c) in Fig. 5.13 were dominated
by plasma deposition or transport of neutrals without appreciable decay. This is
quite similar to the significant deposition on louvers and tile sides facing a large
opening in JET divertor (see Fig. 5.6). In boundary plasma, there are neutral flows
to pumping ducts. Ionized ions and molecules are neutralized by charge exchange
or recombination with electrons to be neutralized. Then, they are transported along
the neutral flow to the plasma shadowed area and remote area. In the case of Cwall, eroded C and hydrocarbons are transported along this flow and consequently
deposited at the plasma shadowed area but on the line of sight from plasma.
This kind of line-of-sight deposition was also observed on the bottom of the tile
gaps. Figure 5.14 shows outboard first wall with and without armor tiles in JT-60U.
The deposition patterns were different with the location of the armer tiles because
the bottom of the tile gap was closed and hence penetrating plasma into the tile
gaps was different depending on the location of the gap and the width and depth
of the gap. Furthermore, at the bottom of the gap, neutral H pressure changes with
the gap width and depth (see the inset in Fig. 5.14). Because the bottom of the gap
was closed, the penetrating plasma particles are neutralized and gas pressure at the
5 Erosion and Deposition and Their Influence on Plasma …
PSL intensity [Arb.Unit]
x: Distance from front [mm]
0
10
20
30
0
10
20
30 0
10
20
30
10 3
10 2
10 1
10 0
10 3
10 2
10 1
10 0
0
10
20
30
(a) Upside
(b) Bottom side
(d) Right side
(c) Left side
Tile:KC2
(a)
(b)
(c)
(d)
)
exp(
)
exp(
)
(
2
2
1
1
x
C
x
C
x
PSL
−
+
−
=
x: Distance from front
λ 1 : Short-term decay length
λ 2 : Long-term decay length
KC2
(a)
(b)
(c)
(d)
Fig. 5.11 T profiles on gap-facing sides of the eroded tile in TFTR is given in Fig. 5.7, which was
quite consistent with the C deposition profiles [8]. Most of the deposits appear near the entrance of
the gap caused by prompt deposition of eroded C at the front surface showing exponentially decays
with the gap depth. In addition, penetration of boundary plasma gave deposition with longer decay
profiles [14]
penetrated in the gap [14]. The decay length of the shorter one changed with not
only the width and depth of the gap but also the location of the gap. Figures 5.12 and
5.13 show C deposition profiles determined for T profiles in tile sides facing toroidal
side and poloidal side, respectively, in JT-60U [15]. The deposition profiles on the
toroidal sides (Fig. 5.12) were dominated with the repetitive processes of erosion
and deposition with the decay length of about 3 mm irrespective of the location,
while the tile sides facing larger opening (b) and (c) in Fig. 5.13 were dominated
by plasma deposition or transport of neutrals without appreciable decay. This is
quite similar to the significant deposition on louvers and tile sides facing a large
opening in JET divertor (see Fig. 5.6). In boundary plasma, there are neutral flows
to pumping ducts. Ionized ions and molecules are neutralized by charge exchange
or recombination with electrons to be neutralized. Then, they are transported along
the neutral flow to the plasma shadowed area and remote area. In the case of Cwall, eroded C and hydrocarbons are transported along this flow and consequently
deposited at the plasma shadowed area but on the line of sight from plasma.
This kind of line-of-sight deposition was also observed on the bottom of the tile
gaps. Figure 5.14 shows outboard first wall with and without armor tiles in JT-60U.
The deposition patterns were different with the location of the armer tiles because
the bottom of the tile gap was closed and hence penetrating plasma into the tile
gaps was different depending on the location of the gap and the width and depth
of the gap. Furthermore, at the bottom of the gap, neutral H pressure changes with
the gap width and depth (see the inset in Fig. 5.14). Because the bottom of the gap
was closed, the penetrating plasma particles are neutralized and gas pressure at the