

9.4 Fuel Retention in Carbon Materials
169
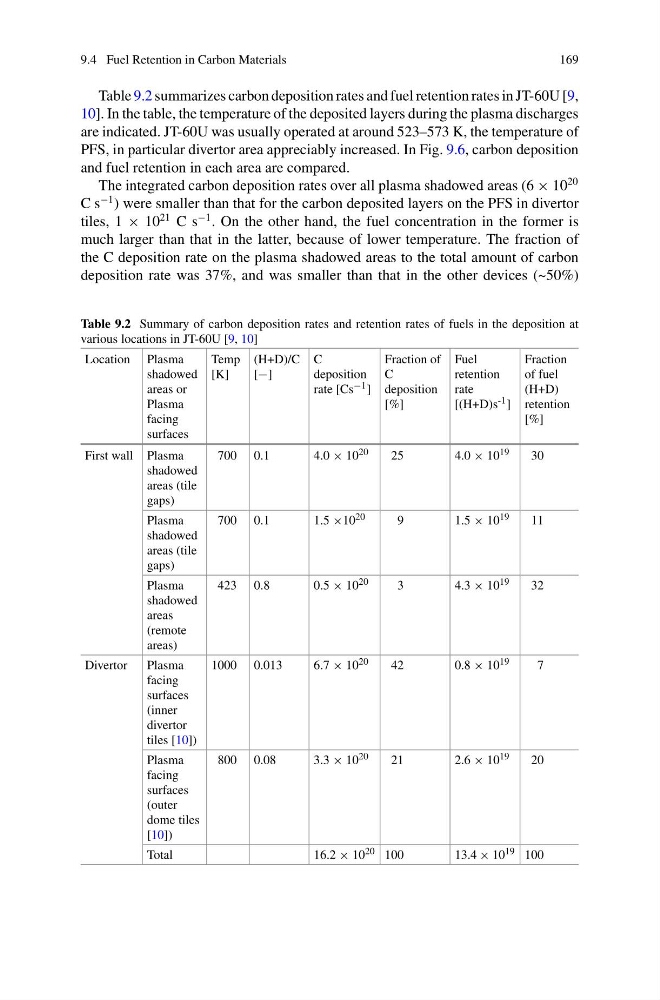
Table 9.2 summarizes carbon deposition rates and fuel retention rates in JT-60U [9,
10]. In the table, the temperature of the deposited layers during the plasma discharges
are indicated. JT-60U was usually operated at around 523–573 K, the temperature of
PFS, in particular divertor area appreciably increased. In Fig. 9.6, carbon deposition
and fuel retention in each area are compared.
The integrated carbon deposition rates over all plasma shadowed areas (6 × 10
20
C s
−1 ) were smaller than that for the carbon deposited layers on the PFS in divertor
tiles, 1 × 10
21 C s
−1 . On the other hand, the fuel concentration in the former is
much larger than that in the latter, because of lower temperature. The fraction of
the C deposition rate on the plasma shadowed areas to the total amount of carbon
deposition rate was 37%, and was smaller than that in the other devices (~50%)
Table 9.2 Summary of carbon deposition rates and retention rates of fuels in the deposition at
various locations in JT-60U [9, 10]
Location Plasma
shadowed
areas or
Plasma
facing
surfaces
Temp
[K]
(H+D)/C
[−]
C
deposition
rate [Cs −1 ]
Fraction of
C
deposition
[%]
Fuel
retention
rate
[(H+D)s -1 ]
Fraction
of fuel
(H+D)
retention
[%]
First wall Plasma
shadowed
areas (tile
gaps)
700 0.1
4.0 × 10 20
25
4.0 × 10 19
30
Plasma
shadowed
areas (tile
gaps)
700 0.1
1.5 ×10 20
9
1.5 × 10 19
11
Plasma
shadowed
areas
(remote
areas)
423 0.8
0.5 × 10 20
3
4.3 × 10 19
32
Divertor
Plasma
facing
surfaces
(inner
divertor
tiles [10])
1000 0.013
6.7 × 10 20
42
0.8 × 10 19
7
Plasma
facing
surfaces
(outer
dome tiles
[10])
800 0.08
3.3 × 10 20
21
2.6 × 10 19
20
Total
16.2 × 10 20 100
13.4 × 10 19 100
169
Table 9.2 summarizes carbon deposition rates and fuel retention rates in JT-60U [9,
10]. In the table, the temperature of the deposited layers during the plasma discharges
are indicated. JT-60U was usually operated at around 523–573 K, the temperature of
PFS, in particular divertor area appreciably increased. In Fig. 9.6, carbon deposition
and fuel retention in each area are compared.
The integrated carbon deposition rates over all plasma shadowed areas (6 × 10
20
C s
−1 ) were smaller than that for the carbon deposited layers on the PFS in divertor
tiles, 1 × 10
21 C s
−1 . On the other hand, the fuel concentration in the former is
much larger than that in the latter, because of lower temperature. The fraction of
the C deposition rate on the plasma shadowed areas to the total amount of carbon
deposition rate was 37%, and was smaller than that in the other devices (~50%)
Table 9.2 Summary of carbon deposition rates and retention rates of fuels in the deposition at
various locations in JT-60U [9, 10]
Location Plasma
shadowed
areas or
Plasma
facing
surfaces
Temp
[K]
(H+D)/C
[−]
C
deposition
rate [Cs −1 ]
Fraction of
C
deposition
[%]
Fuel
retention
rate
[(H+D)s -1 ]
Fraction
of fuel
(H+D)
retention
[%]
First wall Plasma
shadowed
areas (tile
gaps)
700 0.1
4.0 × 10 20
25
4.0 × 10 19
30
Plasma
shadowed
areas (tile
gaps)
700 0.1
1.5 ×10 20
9
1.5 × 10 19
11
Plasma
shadowed
areas
(remote
areas)
423 0.8
0.5 × 10 20
3
4.3 × 10 19
32
Divertor
Plasma
facing
surfaces
(inner
divertor
tiles [10])
1000 0.013
6.7 × 10 20
42
0.8 × 10 19
7
Plasma
facing
surfaces
(outer
dome tiles
[10])
800 0.08
3.3 × 10 20
21
2.6 × 10 19
20
Total
16.2 × 10 20 100
13.4 × 10 19 100