

170
9 Fuel Retention in a Rector with Full …
Inner divertor tile :1000 K
Tile gaps (First wall) : 700K
Outer dome tile :800 K
Remote area (divertor) :423K
Tile gaps (divertor) : 700 K
Plasma facing surface
Plasma shadowed areas
2.6
(20 %)
0.8
(7 %)
0.9
(10 %)
4.0
(31 %)
4.3
(33 %) Total
13.4
x10 19 H+D/s
6.7
(42 %)
0.5
(3 %)
1.3
(8 %)
3.3
(21 %)
4.0
(26 %)
Total
16.2
x10 20 C/s
(b) Fuel (H+D) retenon rate
(a) Carbon deposion rate
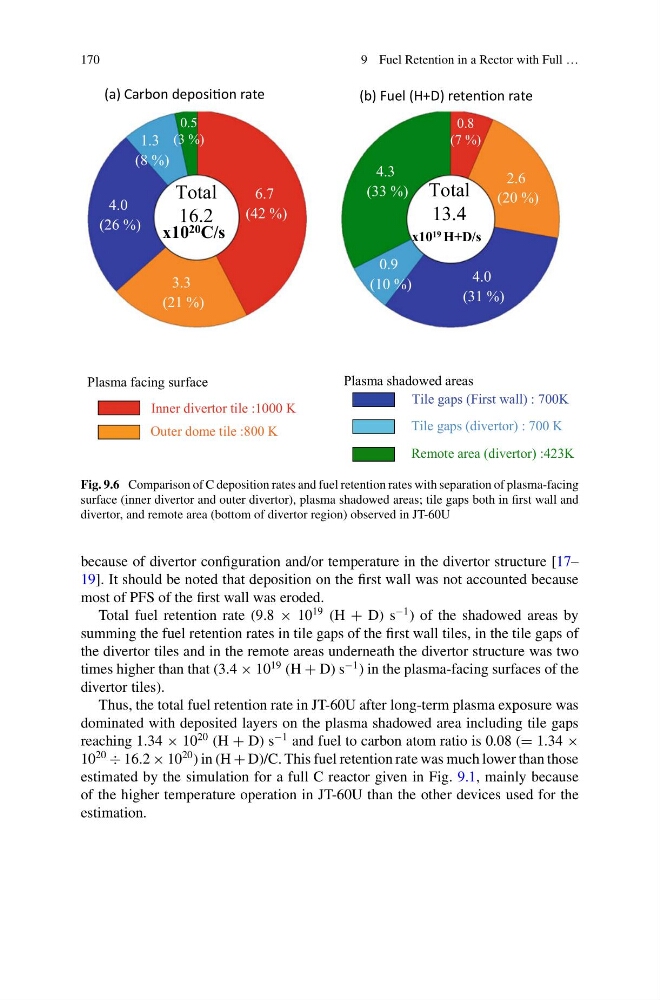
Fig. 9.6 Comparison of C deposition rates and fuel retention rates with separation of plasma-facing
surface (inner divertor and outer divertor), plasma shadowed areas; tile gaps both in first wall and
divertor, and remote area (bottom of divertor region) observed in JT-60U
because of divertor configuration and/or temperature in the divertor structure [17–
19]. It should be noted that deposition on the first wall was not accounted because
most of PFS of the first wall was eroded.
Total fuel retention rate (9.8 × 10
19 (H + D) s
−1 ) of the shadowed areas by
summing the fuel retention rates in tile gaps of the first wall tiles, in the tile gaps of
the divertor tiles and in the remote areas underneath the divertor structure was two
times higher than that (3.4 × 10
19 (H + D) s
−1 ) in the plasma-facing surfaces of the
divertor tiles).
Thus, the total fuel retention rate in JT-60U after long-term plasma exposure was
dominated with deposited layers on the plasma shadowed area including tile gaps
reaching 1.34 × 10
20 (H + D) s
−1 and fuel to carbon atom ratio is 0.08 (= 1.34 ×
10
20
÷ 16.2 × 10
20 ) in (H + D)/C. This fuel retention rate was much lower than those
estimated by the simulation for a full C reactor given in Fig. 9.1, mainly because
of the higher temperature operation in JT-60U than the other devices used for the
estimation.
9 Fuel Retention in a Rector with Full …
Inner divertor tile :1000 K
Tile gaps (First wall) : 700K
Outer dome tile :800 K
Remote area (divertor) :423K
Tile gaps (divertor) : 700 K
Plasma facing surface
Plasma shadowed areas
2.6
(20 %)
0.8
(7 %)
0.9
(10 %)
4.0
(31 %)
4.3
(33 %) Total
13.4
x10 19 H+D/s
6.7
(42 %)
0.5
(3 %)
1.3
(8 %)
3.3
(21 %)
4.0
(26 %)
Total
16.2
x10 20 C/s
(b) Fuel (H+D) retenon rate
(a) Carbon deposion rate
Fig. 9.6 Comparison of C deposition rates and fuel retention rates with separation of plasma-facing
surface (inner divertor and outer divertor), plasma shadowed areas; tile gaps both in first wall and
divertor, and remote area (bottom of divertor region) observed in JT-60U
because of divertor configuration and/or temperature in the divertor structure [17–
19]. It should be noted that deposition on the first wall was not accounted because
most of PFS of the first wall was eroded.
Total fuel retention rate (9.8 × 10
19 (H + D) s
−1 ) of the shadowed areas by
summing the fuel retention rates in tile gaps of the first wall tiles, in the tile gaps of
the divertor tiles and in the remote areas underneath the divertor structure was two
times higher than that (3.4 × 10
19 (H + D) s
−1 ) in the plasma-facing surfaces of the
divertor tiles).
Thus, the total fuel retention rate in JT-60U after long-term plasma exposure was
dominated with deposited layers on the plasma shadowed area including tile gaps
reaching 1.34 × 10
20 (H + D) s
−1 and fuel to carbon atom ratio is 0.08 (= 1.34 ×
10
20
÷ 16.2 × 10
20 ) in (H + D)/C. This fuel retention rate was much lower than those
estimated by the simulation for a full C reactor given in Fig. 9.1, mainly because
of the higher temperature operation in JT-60U than the other devices used for the
estimation.