

6.3 Damaging and Degradation of PFM
103
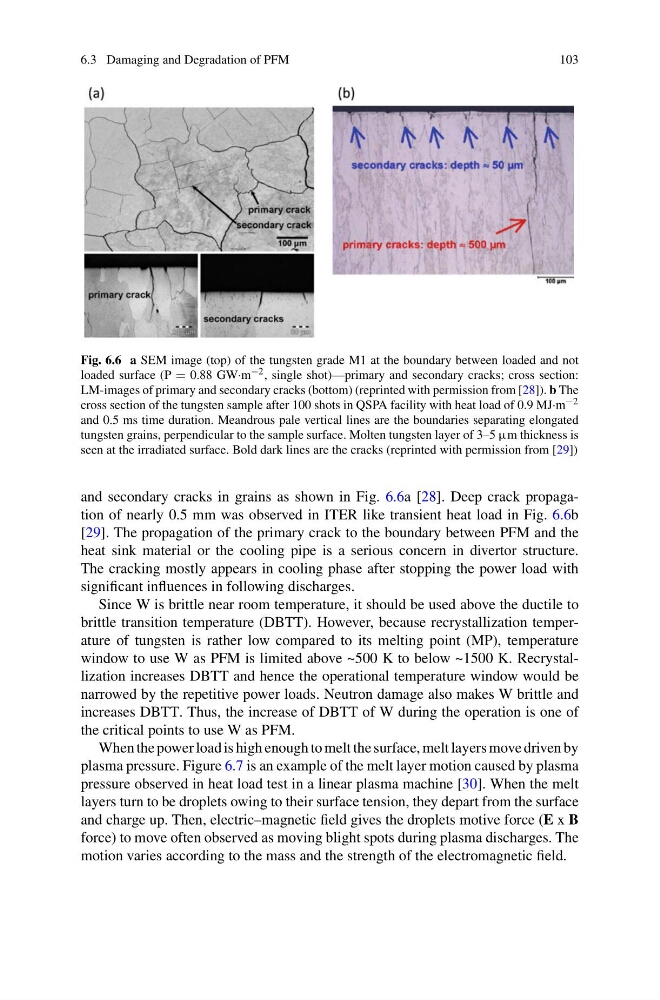
Fig. 6.6 a SEM image (top) of the tungsten grade M1 at the boundary between loaded and not
loaded surface (P = 0.88 GW·m −2 , single shot)—primary and secondary cracks; cross section:
LM-images of primary and secondary cracks (bottom) (reprinted with permission from [28]). b The
cross section of the tungsten sample after 100 shots in QSPA facility with heat load of 0.9 MJ·m −2
and 0.5 ms time duration. Meandrous pale vertical lines are the boundaries separating elongated
tungsten grains, perpendicular to the sample surface. Molten tungsten layer of 3–5 μm thickness is
seen at the irradiated surface. Bold dark lines are the cracks (reprinted with permission from [29])
and secondary cracks in grains as shown in Fig. 6.6a [28]. Deep crack propagation of nearly 0.5 mm was observed in ITER like transient heat load in Fig. 6.6b
[29]. The propagation of the primary crack to the boundary between PFM and the
heat sink material or the cooling pipe is a serious concern in divertor structure.
The cracking mostly appears in cooling phase after stopping the power load with
significant influences in following discharges.
Since W is brittle near room temperature, it should be used above the ductile to
brittle transition temperature (DBTT). However, because recrystallization temperature of tungsten is rather low compared to its melting point (MP), temperature
window to use W as PFM is limited above ~500 K to below ~1500 K. Recrystallization increases DBTT and hence the operational temperature window would be
narrowed by the repetitive power loads. Neutron damage also makes W brittle and
increases DBTT. Thus, the increase of DBTT of W during the operation is one of
the critical points to use W as PFM.
When the power load is high enough to melt the surface, melt layers move driven by
plasma pressure. Figure 6.7 is an example of the melt layer motion caused by plasma
pressure observed in heat load test in a linear plasma machine [30]. When the melt
layers turn to be droplets owing to their surface tension, they depart from the surface
and charge up. Then, electric–magnetic field gives the droplets motive force (E x B
force) to move often observed as moving blight spots during plasma discharges. The
motion varies according to the mass and the strength of the electromagnetic field.
103
Fig. 6.6 a SEM image (top) of the tungsten grade M1 at the boundary between loaded and not
loaded surface (P = 0.88 GW·m −2 , single shot)—primary and secondary cracks; cross section:
LM-images of primary and secondary cracks (bottom) (reprinted with permission from [28]). b The
cross section of the tungsten sample after 100 shots in QSPA facility with heat load of 0.9 MJ·m −2
and 0.5 ms time duration. Meandrous pale vertical lines are the boundaries separating elongated
tungsten grains, perpendicular to the sample surface. Molten tungsten layer of 3–5 μm thickness is
seen at the irradiated surface. Bold dark lines are the cracks (reprinted with permission from [29])
and secondary cracks in grains as shown in Fig. 6.6a [28]. Deep crack propagation of nearly 0.5 mm was observed in ITER like transient heat load in Fig. 6.6b
[29]. The propagation of the primary crack to the boundary between PFM and the
heat sink material or the cooling pipe is a serious concern in divertor structure.
The cracking mostly appears in cooling phase after stopping the power load with
significant influences in following discharges.
Since W is brittle near room temperature, it should be used above the ductile to
brittle transition temperature (DBTT). However, because recrystallization temperature of tungsten is rather low compared to its melting point (MP), temperature
window to use W as PFM is limited above ~500 K to below ~1500 K. Recrystallization increases DBTT and hence the operational temperature window would be
narrowed by the repetitive power loads. Neutron damage also makes W brittle and
increases DBTT. Thus, the increase of DBTT of W during the operation is one of
the critical points to use W as PFM.
When the power load is high enough to melt the surface, melt layers move driven by
plasma pressure. Figure 6.7 is an example of the melt layer motion caused by plasma
pressure observed in heat load test in a linear plasma machine [30]. When the melt
layers turn to be droplets owing to their surface tension, they depart from the surface
and charge up. Then, electric–magnetic field gives the droplets motive force (E x B
force) to move often observed as moving blight spots during plasma discharges. The
motion varies according to the mass and the strength of the electromagnetic field.