

When burned, fossil fuels and biomass all produce CO 2 and the total amount of
emitted CO 2 by fossil fuels use was 32 000 Mt CO2 in 2018. Fossil-C is used at a
large extent for producing electric energy. Different C-fuels have different specific
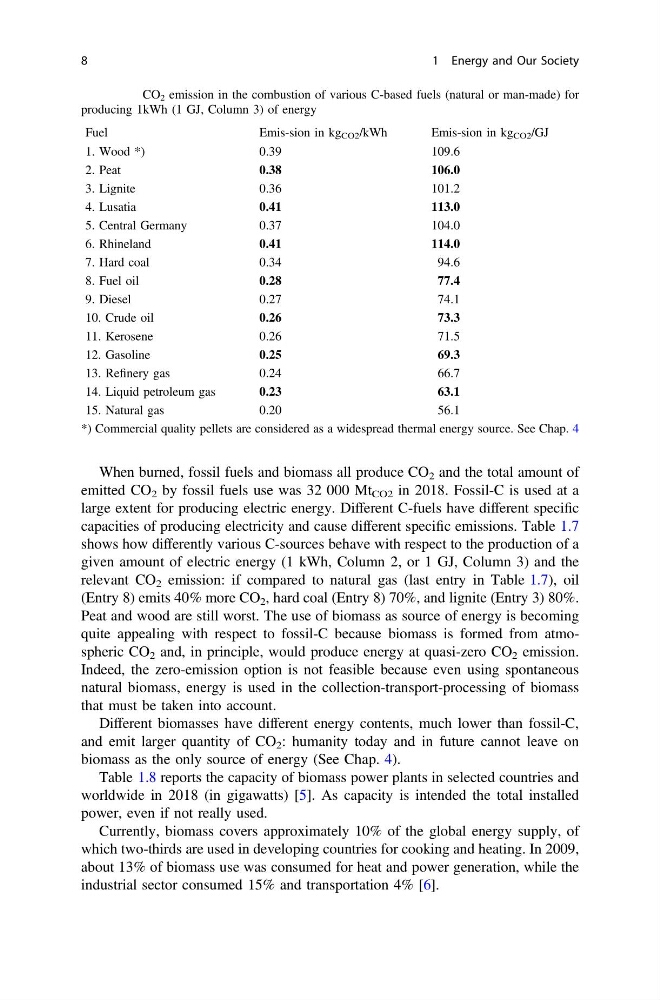
capacities of producing electricity and cause different specific emissions. Table 1.7
shows how differently various C-sources behave with respect to the production of a
given amount of electric energy (1 kWh, Column 2, or 1 GJ, Column 3) and the
relevant CO 2 emission: if compared to natural gas (last entry in Table 1.7), oil
(Entry 8) emits 40% more CO 2 , hard coal (Entry 8) 70%, and lignite (Entry 3) 80%.
Peat and wood are still worst. The use of biomass as source of energy is becoming
quite appealing with respect to fossil-C because biomass is formed from atmospheric CO 2 and, in principle, would produce energy at quasi-zero CO 2 emission.
Indeed, the zero-emission option is not feasible because even using spontaneous
natural biomass, energy is used in the collection-transport-processing of biomass
that must be taken into account.
Different biomasses have different energy contents, much lower than fossil-C,
and emit larger quantity of CO 2 : humanity today and in future cannot leave on
biomass as the only source of energy (See Chap. 4).
Table 1.8 reports the capacity of biomass power plants in selected countries and
worldwide in 2018 (in gigawatts) [5]. As capacity is intended the total installed
power, even if not really used.
Currently, biomass covers approximately 10% of the global energy supply, of
which two-thirds are used in developing countries for cooking and heating. In 2009,
about 13% of biomass use was consumed for heat and power generation, while the
industrial sector consumed 15% and transportation 4% [6].
Table 1.7 CO 2 emission in the combustion of various C-based fuels (natural or man-made) for
producing 1kWh (1 GJ, Column 3) of energy
Fuel
Emis-sion in kg CO2 /kWh
Emis-sion in kg CO2 /GJ
1. Wood *)
0.39
109.6
2. Peat
0.38
106.0
3. Lignite
0.36
101.2
4. Lusatia
0.41
113.0
5. Central Germany
0.37
104.0
6. Rhineland
0.41
114.0
7. Hard coal
0.34
94.6
8. Fuel oil
0.28
77.4
9. Diesel
0.27
74.1
10. Crude oil
0.26
73.3
11. Kerosene
0.26
71.5
12. Gasoline
0.25
69.3
13. Refinery gas
0.24
66.7
14. Liquid petroleum gas
0.23
63.1
15. Natural gas
0.20
56.1
*) Commercial quality pellets are considered as a widespread thermal energy source. See Chap. 4
8
1 Energy and Our Society
emitted CO 2 by fossil fuels use was 32 000 Mt CO2 in 2018. Fossil-C is used at a
large extent for producing electric energy. Different C-fuels have different specific
capacities of producing electricity and cause different specific emissions. Table 1.7
shows how differently various C-sources behave with respect to the production of a
given amount of electric energy (1 kWh, Column 2, or 1 GJ, Column 3) and the
relevant CO 2 emission: if compared to natural gas (last entry in Table 1.7), oil
(Entry 8) emits 40% more CO 2 , hard coal (Entry 8) 70%, and lignite (Entry 3) 80%.
Peat and wood are still worst. The use of biomass as source of energy is becoming
quite appealing with respect to fossil-C because biomass is formed from atmospheric CO 2 and, in principle, would produce energy at quasi-zero CO 2 emission.
Indeed, the zero-emission option is not feasible because even using spontaneous
natural biomass, energy is used in the collection-transport-processing of biomass
that must be taken into account.
Different biomasses have different energy contents, much lower than fossil-C,
and emit larger quantity of CO 2 : humanity today and in future cannot leave on
biomass as the only source of energy (See Chap. 4).
Table 1.8 reports the capacity of biomass power plants in selected countries and
worldwide in 2018 (in gigawatts) [5]. As capacity is intended the total installed
power, even if not really used.
Currently, biomass covers approximately 10% of the global energy supply, of
which two-thirds are used in developing countries for cooking and heating. In 2009,
about 13% of biomass use was consumed for heat and power generation, while the
industrial sector consumed 15% and transportation 4% [6].
Table 1.7 CO 2 emission in the combustion of various C-based fuels (natural or man-made) for
producing 1kWh (1 GJ, Column 3) of energy
Fuel
Emis-sion in kg CO2 /kWh
Emis-sion in kg CO2 /GJ
1. Wood *)
0.39
109.6
2. Peat
0.38
106.0
3. Lignite
0.36
101.2
4. Lusatia
0.41
113.0
5. Central Germany
0.37
104.0
6. Rhineland
0.41
114.0
7. Hard coal
0.34
94.6
8. Fuel oil
0.28
77.4
9. Diesel
0.27
74.1
10. Crude oil
0.26
73.3
11. Kerosene
0.26
71.5
12. Gasoline
0.25
69.3
13. Refinery gas
0.24
66.7
14. Liquid petroleum gas
0.23
63.1
15. Natural gas
0.20
56.1
*) Commercial quality pellets are considered as a widespread thermal energy source. See Chap. 4
8
1 Energy and Our Society