

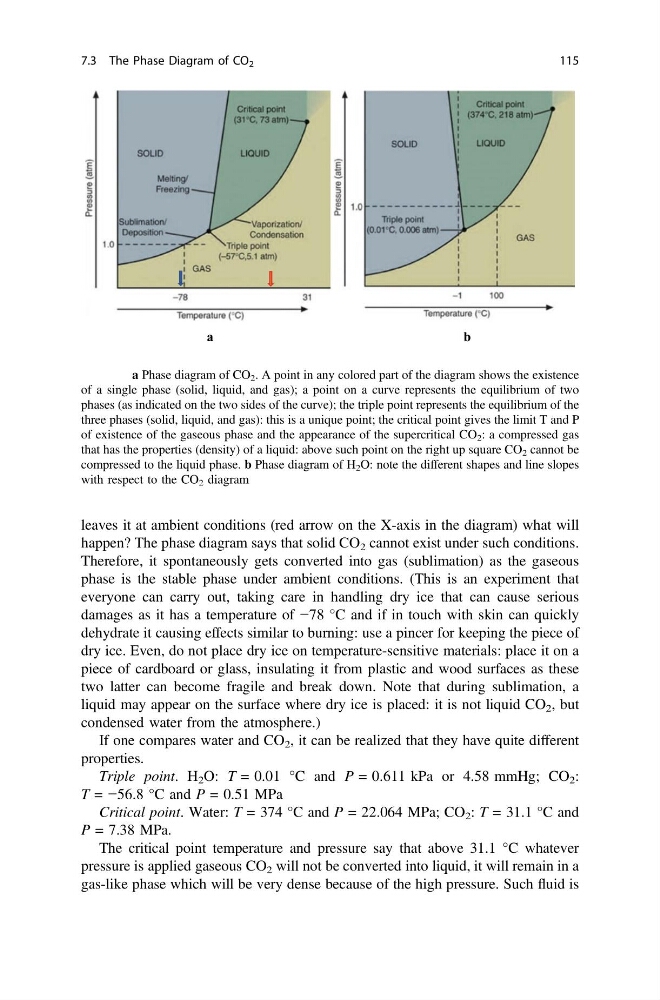
leaves it at ambient conditions (red arrow on the X-axis in the diagram) what will
happen? The phase diagram says that solid CO 2 cannot exist under such conditions.
Therefore, it spontaneously gets converted into gas (sublimation) as the gaseous
phase is the stable phase under ambient conditions. (This is an experiment that
everyone can carry out, taking care in handling dry ice that can cause serious
damages as it has a temperature of −78 °C and if in touch with skin can quickly
dehydrate it causing effects similar to burning: use a pincer for keeping the piece of
dry ice. Even, do not place dry ice on temperature-sensitive materials: place it on a
piece of cardboard or glass, insulating it from plastic and wood surfaces as these
two latter can become fragile and break down. Note that during sublimation, a
liquid may appear on the surface where dry ice is placed: it is not liquid CO 2 , but
condensed water from the atmosphere.)
If one compares water and CO 2 , it can be realized that they have quite different
properties.
Triple point. H 2 O: T = 0.01 °C and P = 0.611 kPa or 4.58 mmHg; CO 2 :
T = −56.8 °C and P = 0.51 MPa
Critical point. Water: T = 374 °C and P = 22.064 MPa; CO 2 : T = 31.1 °C and
P = 7.38 MPa.
The critical point temperature and pressure say that above 31.1 °C whatever
pressure is applied gaseous CO 2 will not be converted into liquid, it will remain in a
gas-like phase which will be very dense because of the high pressure. Such fluid is
a
b
Fig. 7.9 a Phase diagram of CO 2 . A point in any colored part of the diagram shows the existence
of a single phase (solid, liquid, and gas); a point on a curve represents the equilibrium of two
phases (as indicated on the two sides of the curve); the triple point represents the equilibrium of the
three phases (solid, liquid, and gas): this is a unique point; the critical point gives the limit T and P
of existence of the gaseous phase and the appearance of the supercritical CO 2 : a compressed gas
that has the properties (density) of a liquid: above such point on the right up square CO 2 cannot be
compressed to the liquid phase. b Phase diagram of H 2 O: note the different shapes and line slopes
with respect to the CO 2 diagram
7.3 The Phase Diagram of CO 2
115
happen? The phase diagram says that solid CO 2 cannot exist under such conditions.
Therefore, it spontaneously gets converted into gas (sublimation) as the gaseous
phase is the stable phase under ambient conditions. (This is an experiment that
everyone can carry out, taking care in handling dry ice that can cause serious
damages as it has a temperature of −78 °C and if in touch with skin can quickly
dehydrate it causing effects similar to burning: use a pincer for keeping the piece of
dry ice. Even, do not place dry ice on temperature-sensitive materials: place it on a
piece of cardboard or glass, insulating it from plastic and wood surfaces as these
two latter can become fragile and break down. Note that during sublimation, a
liquid may appear on the surface where dry ice is placed: it is not liquid CO 2 , but
condensed water from the atmosphere.)
If one compares water and CO 2 , it can be realized that they have quite different
properties.
Triple point. H 2 O: T = 0.01 °C and P = 0.611 kPa or 4.58 mmHg; CO 2 :
T = −56.8 °C and P = 0.51 MPa
Critical point. Water: T = 374 °C and P = 22.064 MPa; CO 2 : T = 31.1 °C and
P = 7.38 MPa.
The critical point temperature and pressure say that above 31.1 °C whatever
pressure is applied gaseous CO 2 will not be converted into liquid, it will remain in a
gas-like phase which will be very dense because of the high pressure. Such fluid is
a
b
Fig. 7.9 a Phase diagram of CO 2 . A point in any colored part of the diagram shows the existence
of a single phase (solid, liquid, and gas); a point on a curve represents the equilibrium of two
phases (as indicated on the two sides of the curve); the triple point represents the equilibrium of the
three phases (solid, liquid, and gas): this is a unique point; the critical point gives the limit T and P
of existence of the gaseous phase and the appearance of the supercritical CO 2 : a compressed gas
that has the properties (density) of a liquid: above such point on the right up square CO 2 cannot be
compressed to the liquid phase. b Phase diagram of H 2 O: note the different shapes and line slopes
with respect to the CO 2 diagram
7.3 The Phase Diagram of CO 2
115