

14 Best Practices for Surrogate Based Uncertainty Quantification in. . .
433
It is also common to characterize input uncertainties as Beta distributions [3],
as they offer the flexibility of representing either truncated Gaussian Distributions
(symmetric beta distributions), uniform distributions, and non-symmetrical beta
distributions. This is attained by increasing or decreasing the relative importance of
the uncertain parameter along the desired interval through its probability distribution
function.
14.2.4.2 Definition of Objective Function (I), Robust Design
Robust optimization techniques deal with the influence of operative fluctuations
on the overall design, assuming no catastrophic failures. In this case the main
goal is to obtain an optimum design that produces the best performance for all
possible combinations of the uncertain operating conditions. It is equivalent to
minimizing the performance loss due to the uncertainties in the geometry or
operating conditions.
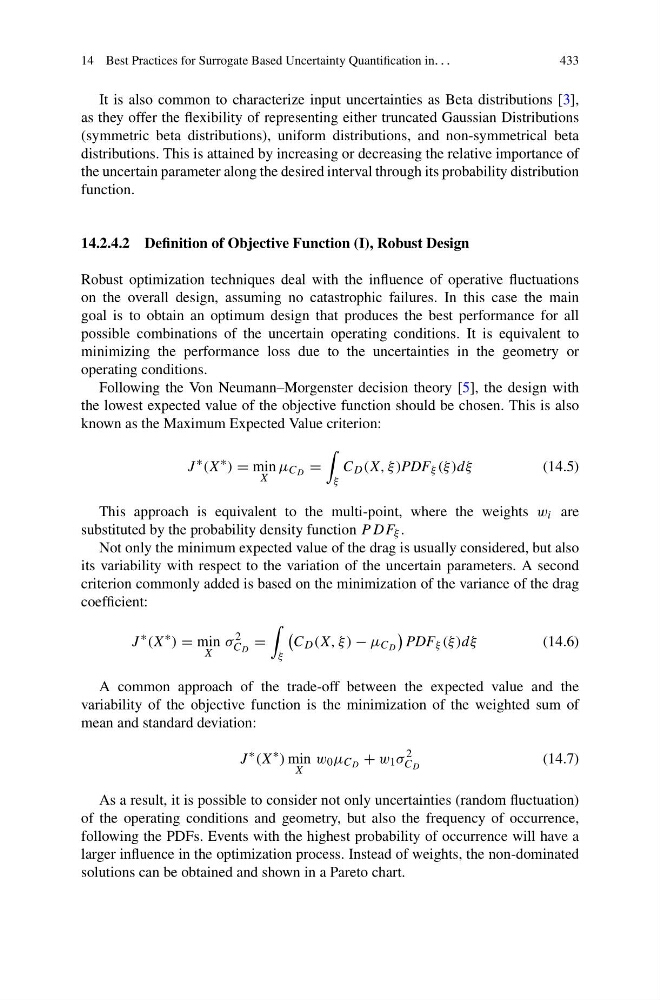
Following the Von Neumann–Morgenster decision theory [5], the design with
the lowest expected value of the objective function should be chosen. This is also
known as the Maximum Expected Value criterion:
J
∗ (X
∗ ) = min
X
μ C D =
ξ
C D (X, ξ )PDF ξ (ξ )dξ
(14.5)
This approach is equivalent to the multi-point, where the weights w i are
substituted by the probability density function P DF ξ .
Not only the minimum expected value of the drag is usually considered, but also
its variability with respect to the variation of the uncertain parameters. A second
criterion commonly added is based on the minimization of the variance of the drag
coefficient:
J
∗ (X
∗ ) = min
X
σ
2
C D
=
ξ
C D (X, ξ ) − μ C D
PDF ξ (ξ )dξ
(14.6)
A common approach of the trade-off between the expected value and the
variability of the objective function is the minimization of the weighted sum of
mean and standard deviation:
J
∗ (X
∗ ) min
X
w 0 μ C D + w 1 σ
2
C D
(14.7)
As a result, it is possible to consider not only uncertainties (random fluctuation)
of the operating conditions and geometry, but also the frequency of occurrence,
following the PDFs. Events with the highest probability of occurrence will have a
larger influence in the optimization process. Instead of weights, the non-dominated
solutions can be obtained and shown in a Pareto chart.
433
It is also common to characterize input uncertainties as Beta distributions [3],
as they offer the flexibility of representing either truncated Gaussian Distributions
(symmetric beta distributions), uniform distributions, and non-symmetrical beta
distributions. This is attained by increasing or decreasing the relative importance of
the uncertain parameter along the desired interval through its probability distribution
function.
14.2.4.2 Definition of Objective Function (I), Robust Design
Robust optimization techniques deal with the influence of operative fluctuations
on the overall design, assuming no catastrophic failures. In this case the main
goal is to obtain an optimum design that produces the best performance for all
possible combinations of the uncertain operating conditions. It is equivalent to
minimizing the performance loss due to the uncertainties in the geometry or
operating conditions.
Following the Von Neumann–Morgenster decision theory [5], the design with
the lowest expected value of the objective function should be chosen. This is also
known as the Maximum Expected Value criterion:
J
∗ (X
∗ ) = min
X
μ C D =
ξ
C D (X, ξ )PDF ξ (ξ )dξ
(14.5)
This approach is equivalent to the multi-point, where the weights w i are
substituted by the probability density function P DF ξ .
Not only the minimum expected value of the drag is usually considered, but also
its variability with respect to the variation of the uncertain parameters. A second
criterion commonly added is based on the minimization of the variance of the drag
coefficient:
J
∗ (X
∗ ) = min
X
σ
2
C D
=
ξ
C D (X, ξ ) − μ C D
PDF ξ (ξ )dξ
(14.6)
A common approach of the trade-off between the expected value and the
variability of the objective function is the minimization of the weighted sum of
mean and standard deviation:
J
∗ (X
∗ ) min
X
w 0 μ C D + w 1 σ
2
C D
(14.7)
As a result, it is possible to consider not only uncertainties (random fluctuation)
of the operating conditions and geometry, but also the frequency of occurrence,
following the PDFs. Events with the highest probability of occurrence will have a
larger influence in the optimization process. Instead of weights, the non-dominated
solutions can be obtained and shown in a Pareto chart.